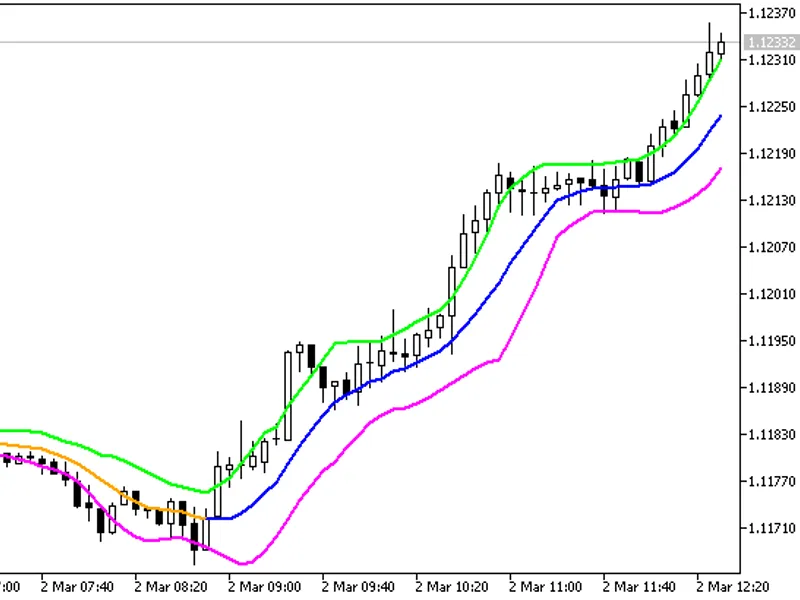
3 Rules MA C D
This tool for MetaTrader 5 is specifically engineered to streamline your trading operations. This technical indicator acts as a specialized analysis tool designed to visualize market data. It helps traders identify emerging trends, momentum shifts, and key support or resistance levels by plotting statistical calculations directly onto price charts.
How to Setup and Use 3 Rules MA C D
1. Installation: Place your file in the MQL/Indicators folder via "Open Data Folder" and restart your terminal.
2. Loading: Find the indicator in the Navigator, drag it onto your chart, and configure the input parameters in the popup window.
3. Customization: Press Ctrl+I to open the indicator list, select your tool, and click "Properties" to change colors, levels, or visual styles.
4. Updating: Replace the old file in the Indicators folder with the new version and restart the platform to apply changes.
Frequently Asked Questions
Q: Why is my indicator not showing? A: Verify the file is in the MQL/Indicators folder, or try right-clicking the "Indicators" tree in the Navigator and clicking "Refresh."
Q: Do custom indicators slow down the platform? A: Too many complex indicators can impact performance; remove unused ones via the "Indicator List" (Ctrl+I).
Q: Can I use MT4 indicators on MT5? A: No, MQL4 and MQL5 are distinct languages; ensure the indicator is compiled specifically for your platform version.
Description & Settings
Almost every trader used or at least took a look at Gerald Appel's MACD. Looking at our Old Bag of Tricks we rescued a technique several traders used/use which is adding additional filters to MACD in order to avoid false or weak entry signals over traditional crossovers.
The rules are quite simple and we split the indicator in 2 parts, so the user can use the first part as a starting point for a trading setup - for manual trading or plugging in into an EA - and the second one as a visualizer for the patterns being found in the chart. We love visual cues so we did the maximum in this second part so the users willing to use this indicator as a part of a setup (or filter) in a manual trading operation gaining visual aids as the entry point is arriving.
Buy Signal
When MACD line (blue) crosses below the Signal line (dotted orange), AND.
When MACD line crosses below Zero line, AND.
When MACD line crosses above the Signal line. Sell Signal
When MACD line (blue) crosses above the Signal line (dotted orange), AND.
When MACD line crosses above Zero line, AND.
When MACD line crosses below the Signal line.
Indicator 1
Minions.3RulesMACD_Signal
can be used alone and/or be plugged in as a entry signal or a filter. It shows on a chart the theoretical BUY and SELL signals as colored arrows.
Indicator 2 -
Minions.3RulesMACD_Patterns
can be added to the chart along with indicator 1 or used alone. Both indicators have no internal bond between them. This indicator 2 will open in a sub window, plot the traditional MACD in a 2-line format (no Histogram) and additionally will plot in colors the formations of the entry points, numbering them as 1-2-3, being 3 the climax, that corresponds the the arrows found in Signal indicator 1.
Hope this indicator will be useful to the community!
Please feel free to post bugs, comments, ideas and tips on what type of markets, stocks and timeframes this indicator performs well.