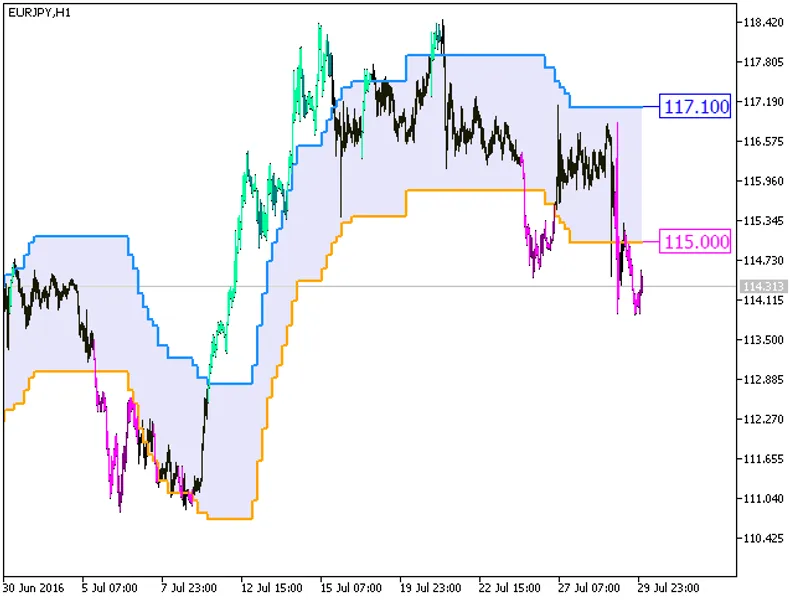
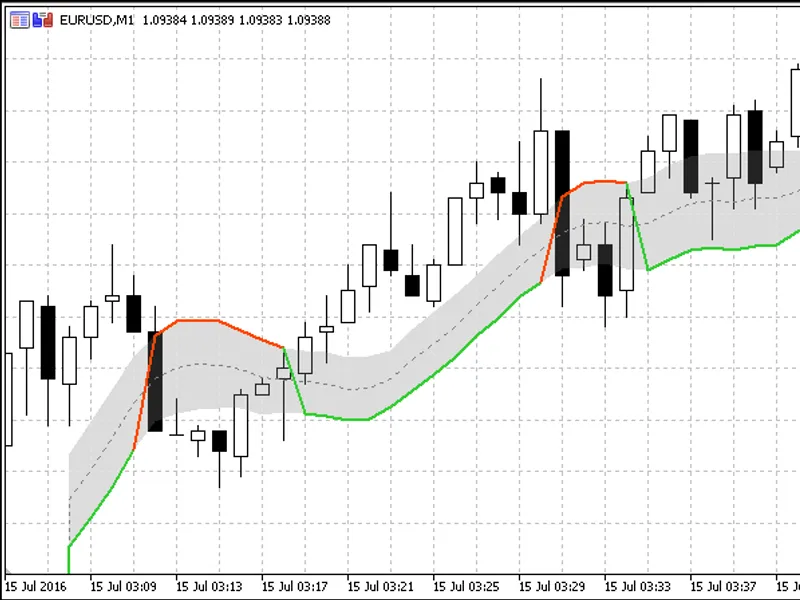
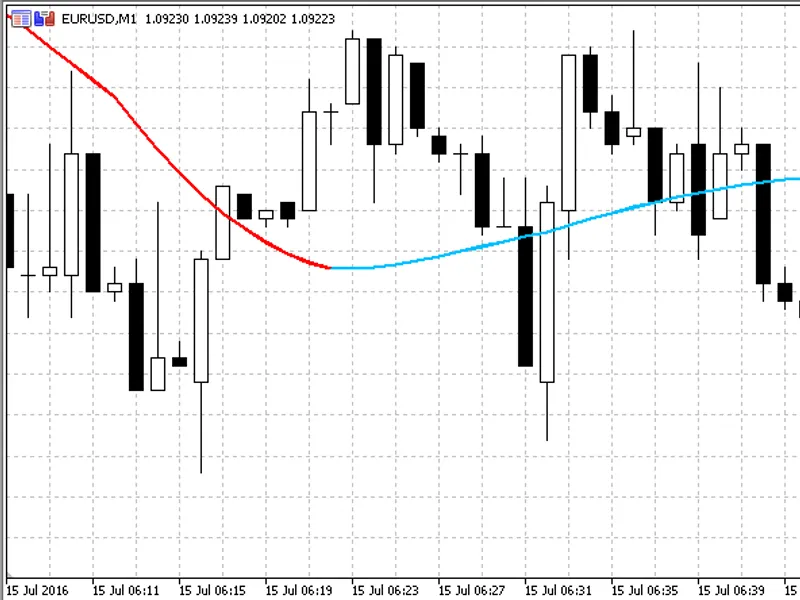
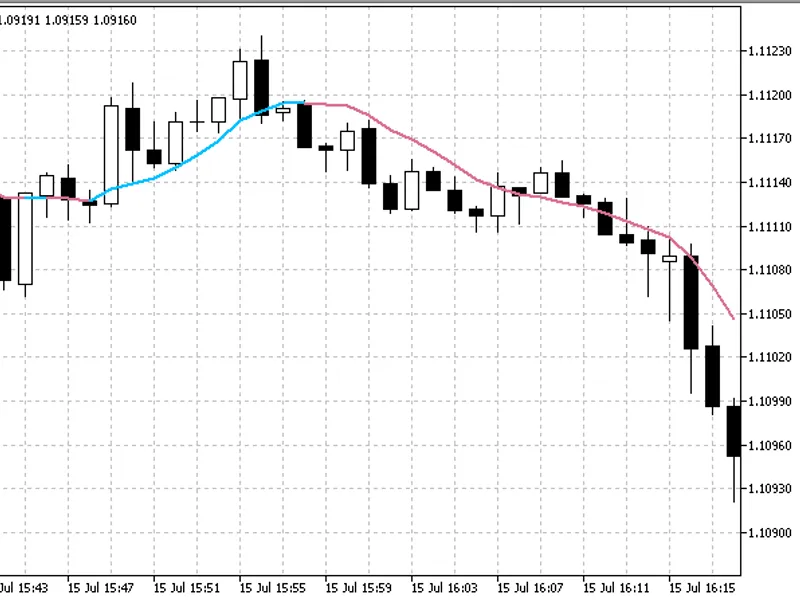
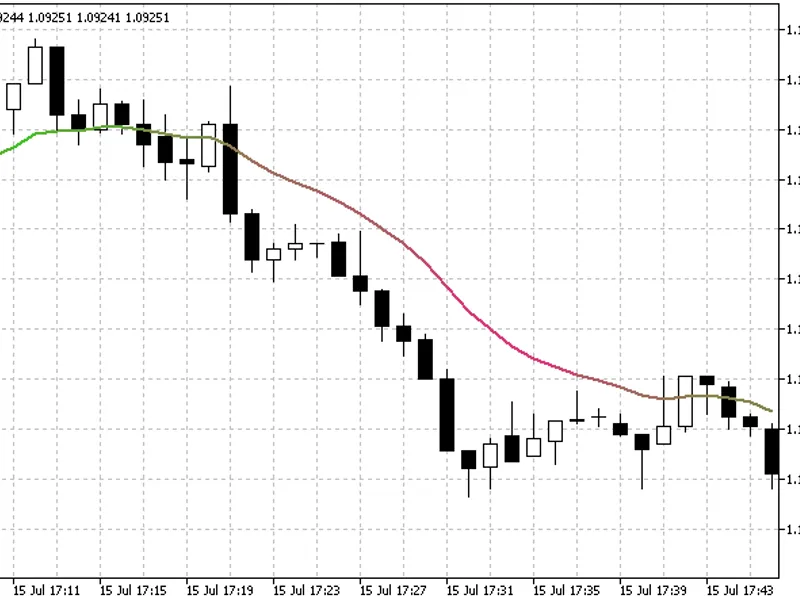
The i-CAI Channel HTF indicator offers a versatile timeframe selection feature in its input parameters.To utilize this indicator, ensure you have the i-CAIChannel.mq5 file placed i...
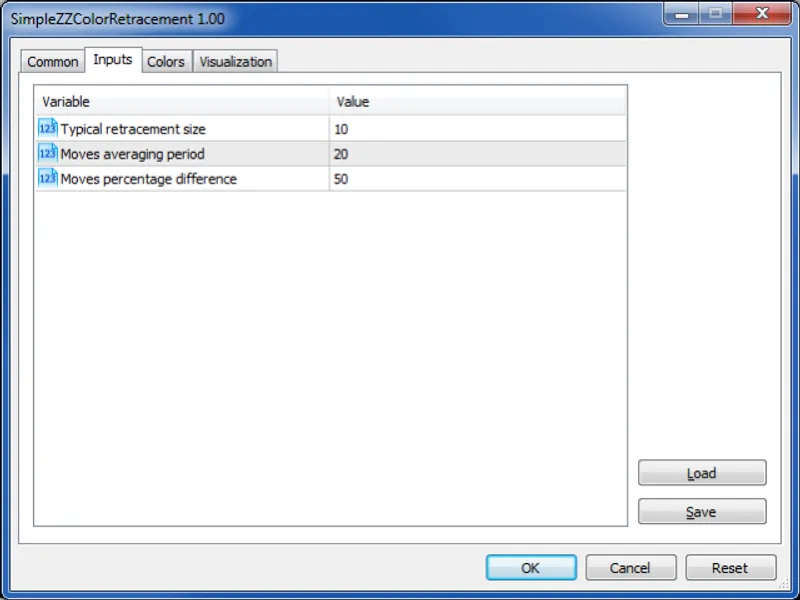
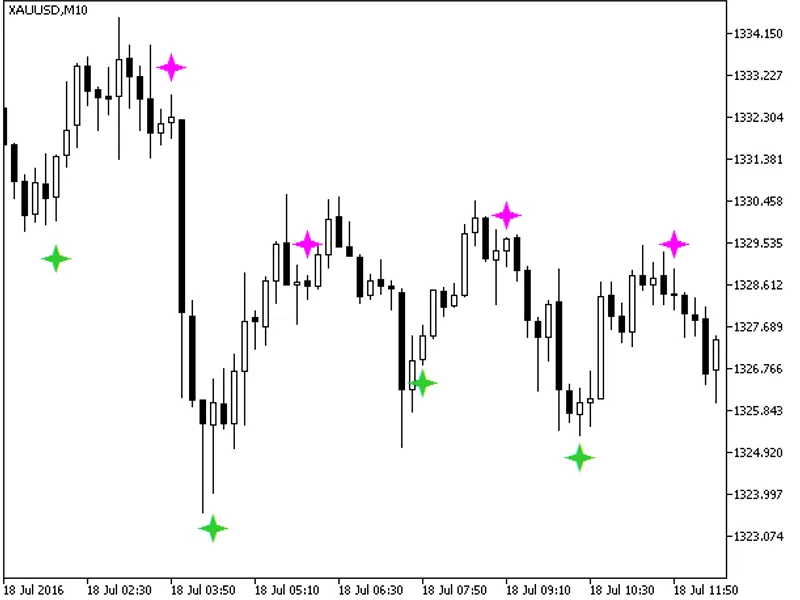
The ZZ Color Retracement Indicator is an advanced tool based on the Simple Zigzag Indicator, offering enhanced functionality for technical analysis.This indicator provides a compre...
Oscillator with calculations using an algorithm similar to Kaufmann's AMA.The indicator utilizes the SmoothAlgorithms.mqh library classes (ensure you copy it to \mql5\include). The...
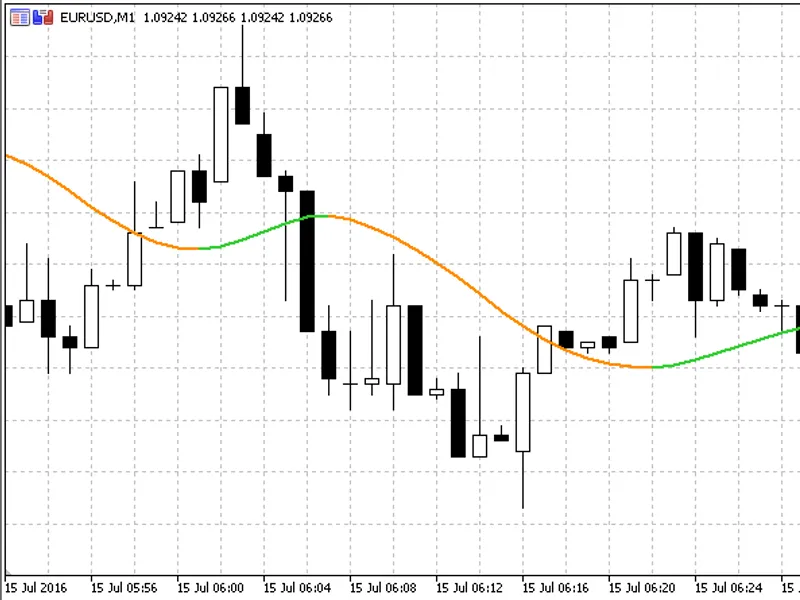
The i-cai digit HTF indicator offers a unique feature: the ability to select the timeframe directly from the input parameters.To use this indicator, you'll need the i-cai_digit.mq5...
MetaTrader 5
indicator
the indicator with the timeframe selection option available in input parameters:the indicator requires pfe.mq5 indicator file. place it in <terminal_data_folder>\mql5\indicat...
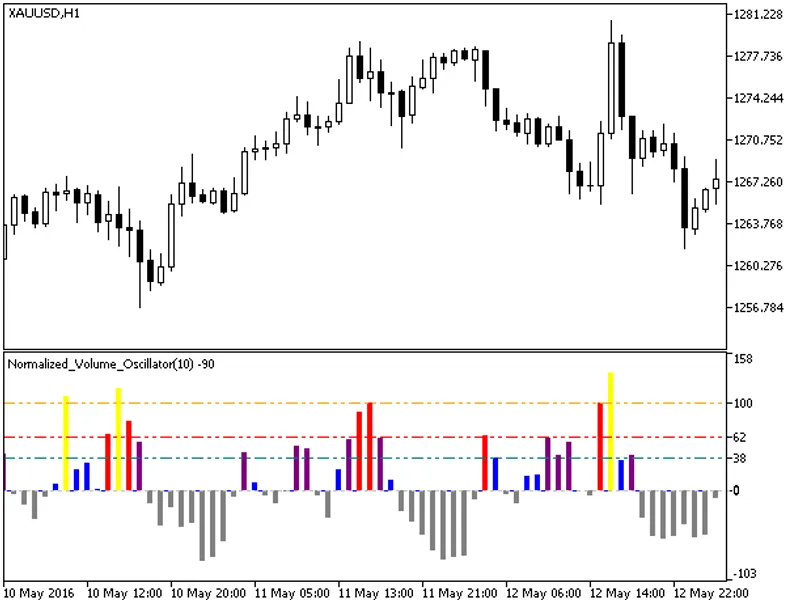
The indicator is a development of the idea of using the normalized volume oscillator.This indicator provides a unique perspective on market activity by normalizing volume values an...
The Stochastic Candle Indicator colors the candles based on the stochastic:- Lime — Stochastic is in the overbought area.- Teal — Stochastic is above the signal line and outside th...
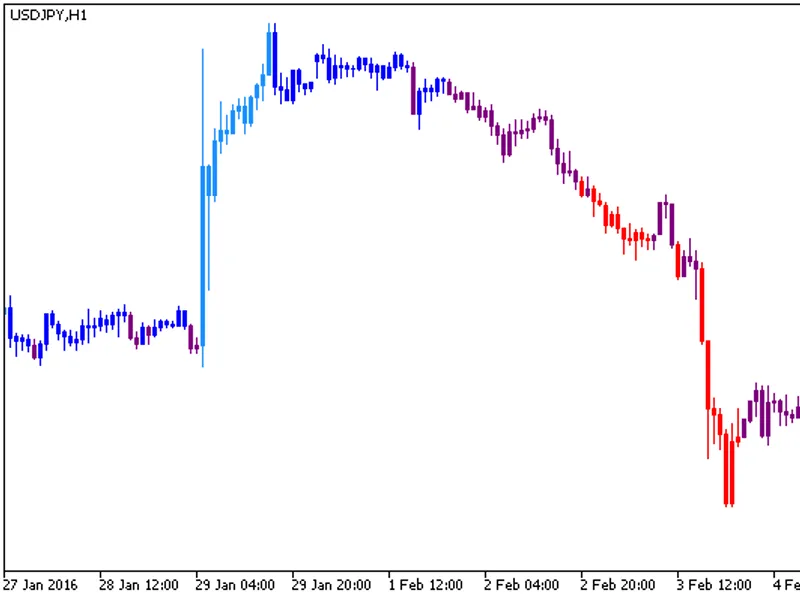
The RS iDiv Candle indicator colors the candles based on the RSI oscillator:- Blue — RSI is in the overbought area- Dodger Blue — RSI is above the 50 level and outside the overboug...
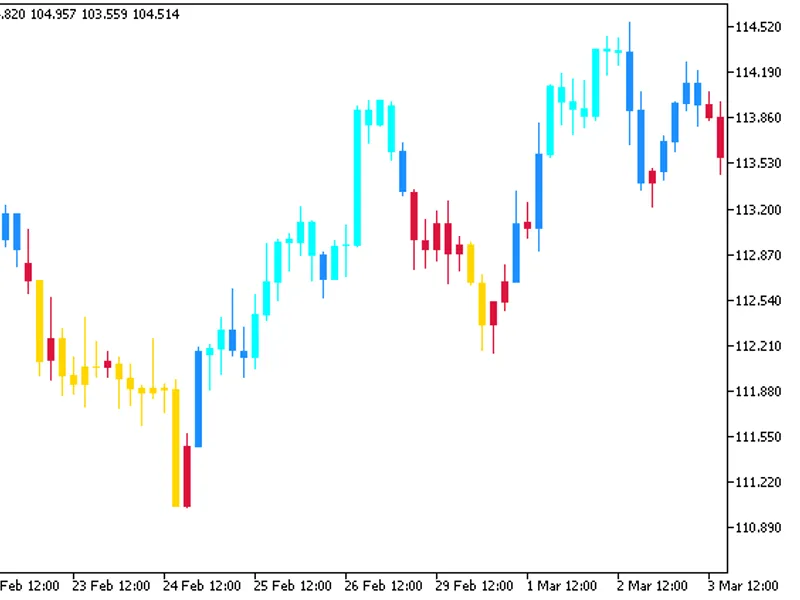
The WPR Divergence Candle indicator colors the candles based on the WPR oscillator:- Aqua — WPR is in the overbought area;- Dodger Blue — WPR is above the -50 level and outside the...
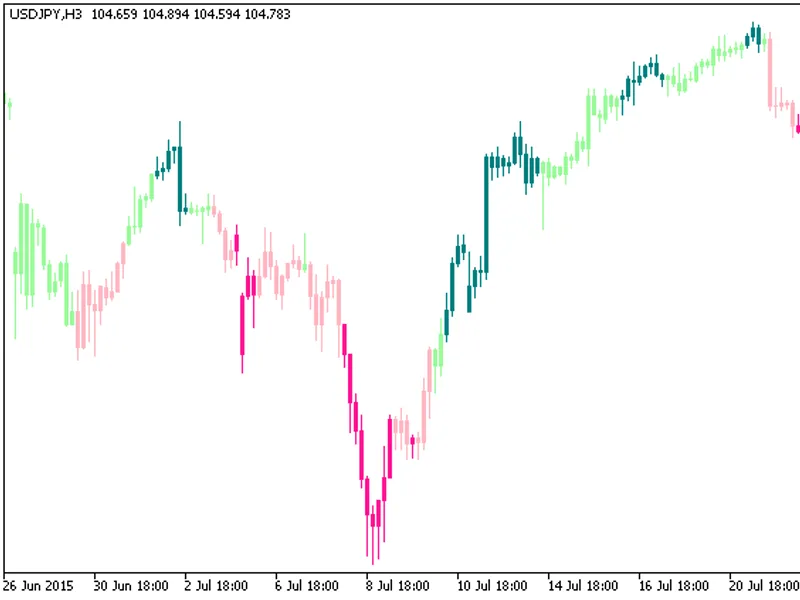
The MFIDIV Candle indicator colors the candles based on the Money Flow Index (MFI) oscillator:- Teal — MFI is in the overbought area.- Pale green — MFI is above the 50 level and ou...
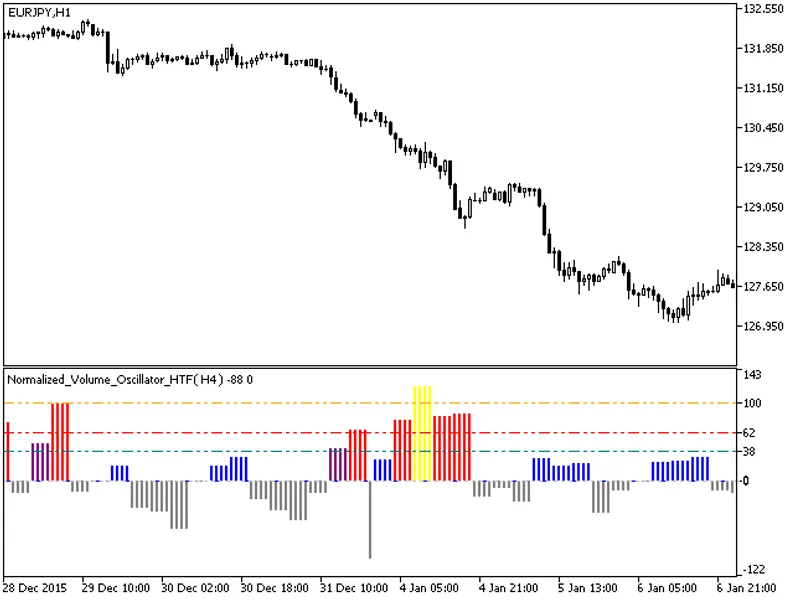
The indicator with the timeframe selection option available in the input parameters.This indicator requires the normalized_volume_oscillator.mq5 indicator file. Place it in <ter...
Tom BalfeAn ordinary oscillator with calculations based on the formula:ppo=(fastema-slowema)/slowemaThe indicator uses SmoothAlgorithms.mqh library classes (copy it to \mql5\includ...
The i-CAI Channel System Digit HTF indicator offers a unique feature: the ability to select the timeframe directly from the input parameters.This indicator requires the i-CAIChanne...
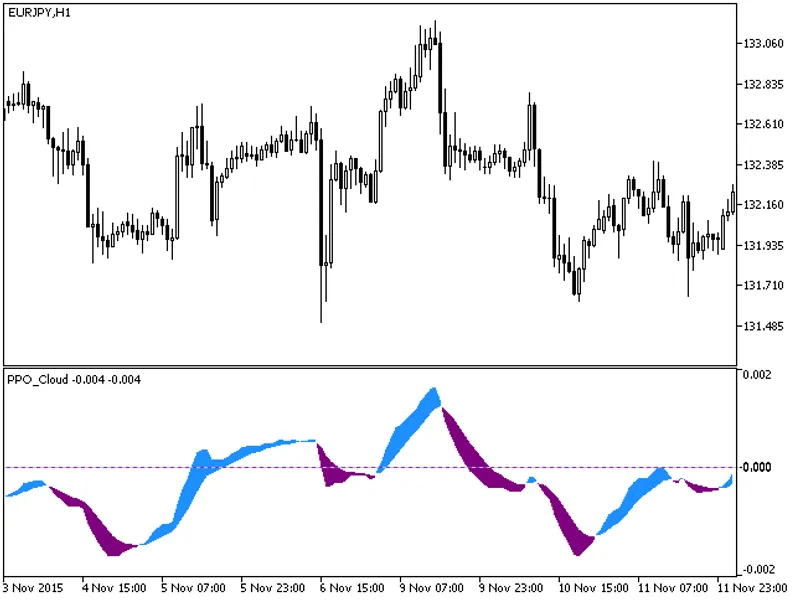
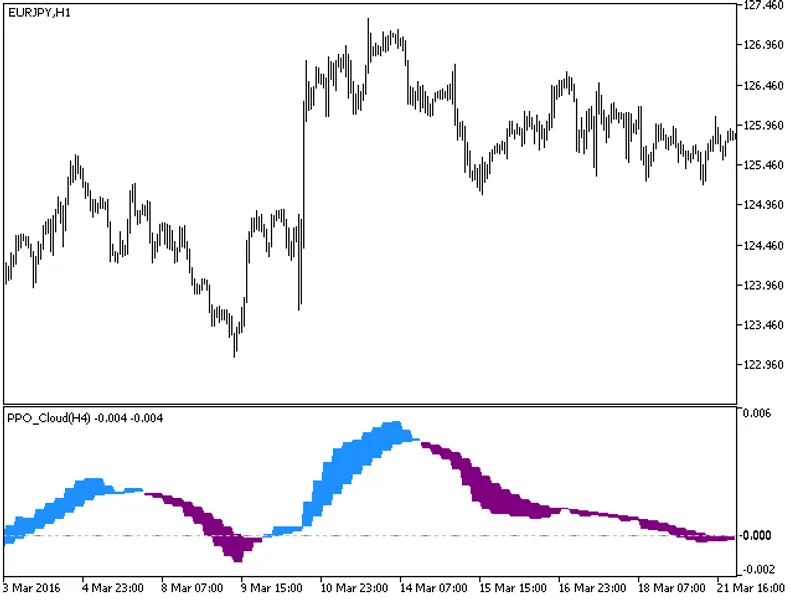
The indicator with the timeframe selection option available in the input parameters.The indicator requires the PPO_Cloud.mq5 indicator file. Place it in <terminal_data_folder>...
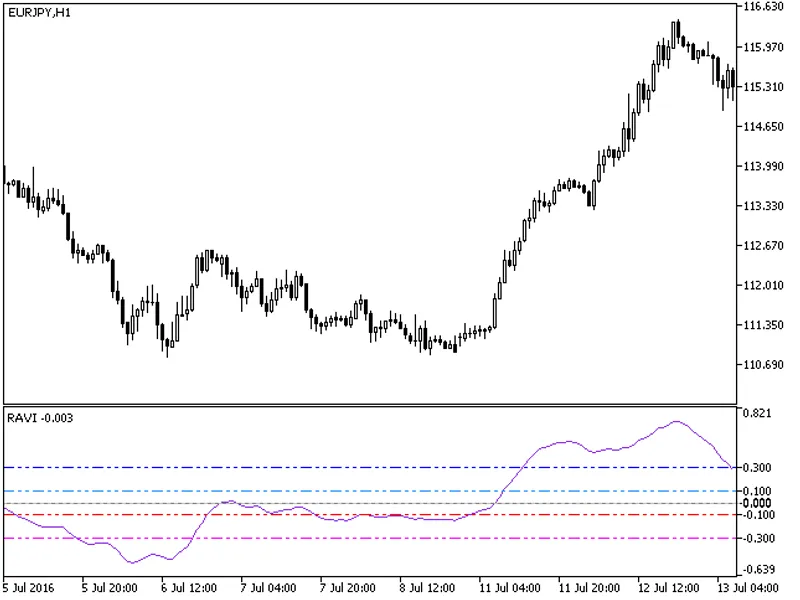
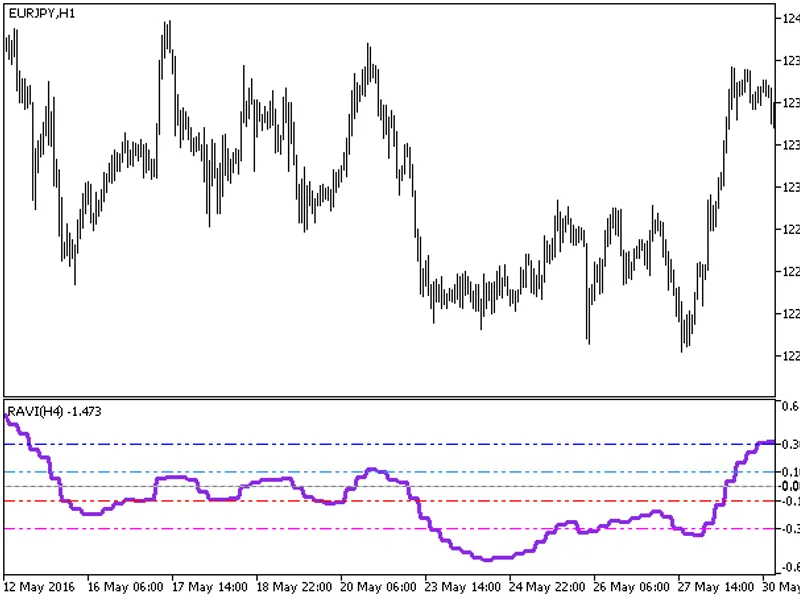
The Ravi indicator, also known as the Range Action Verification Index, is a valuable tool for traders to analyze market trends and make informed decisions.This indicator measures t...
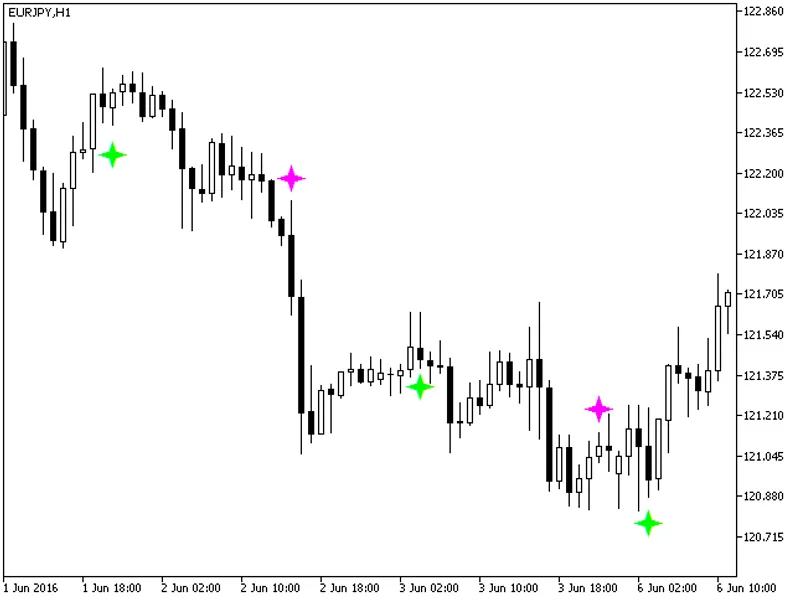
The PPO Sign Indicator is a semaphore signal indicator based on the PPO (Price Percentage Oscillator).This indicator utilizes the SmoothAlgorithms.mqh library classes, which should...
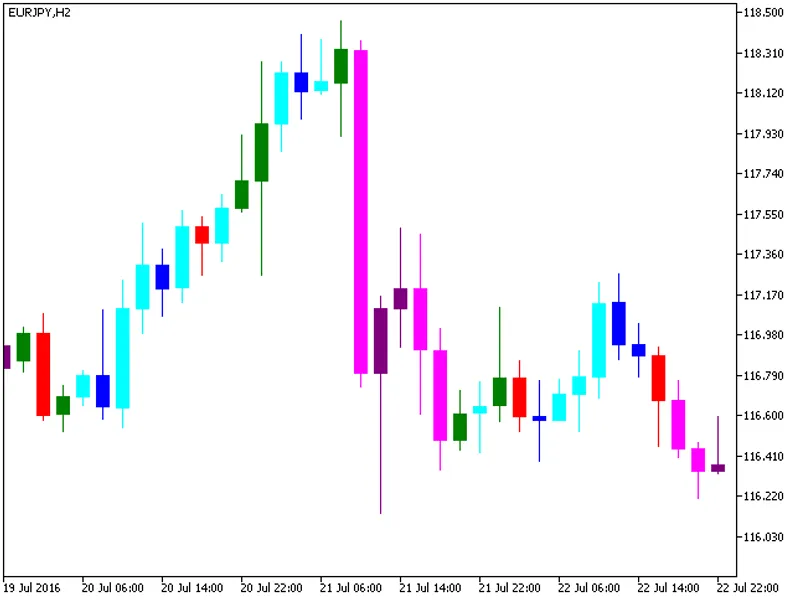
The indicator colors the candlesticks according to B. Williams:- Uptrend and growing candles - aqua;- Uptrend and falling candles - blue;- No trend and growing candles - green;- No...
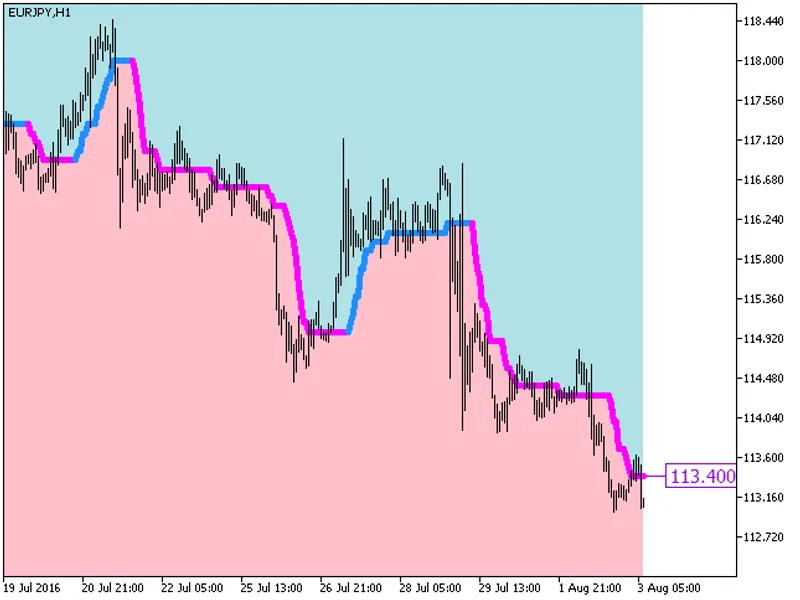
The indicator fills the chart space with a colored background and displays the most recent value as a price label. It allows for rounding channel levels to a specified number of di...
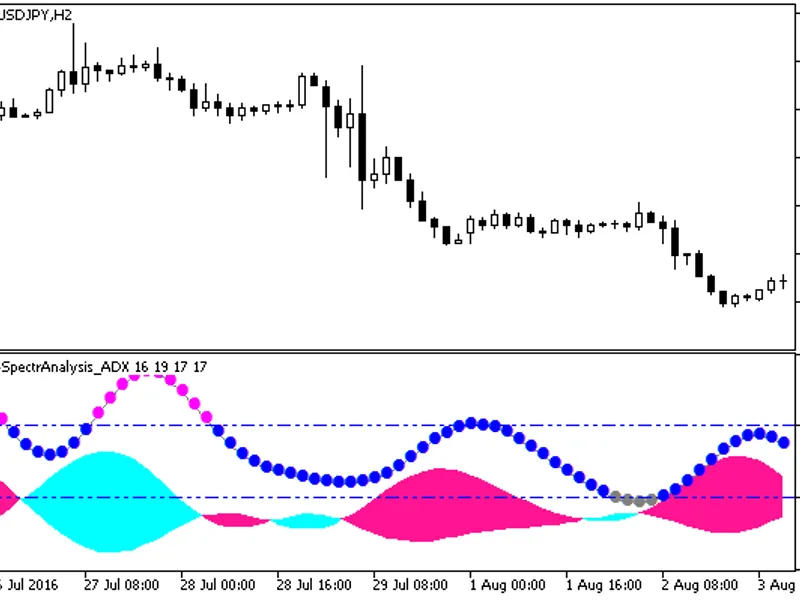
KlotThe indicator smooths the time series of the ADX indicator by filtering harmonics of higher order.This method can be used to smooth the values of any indicators, with the key b...
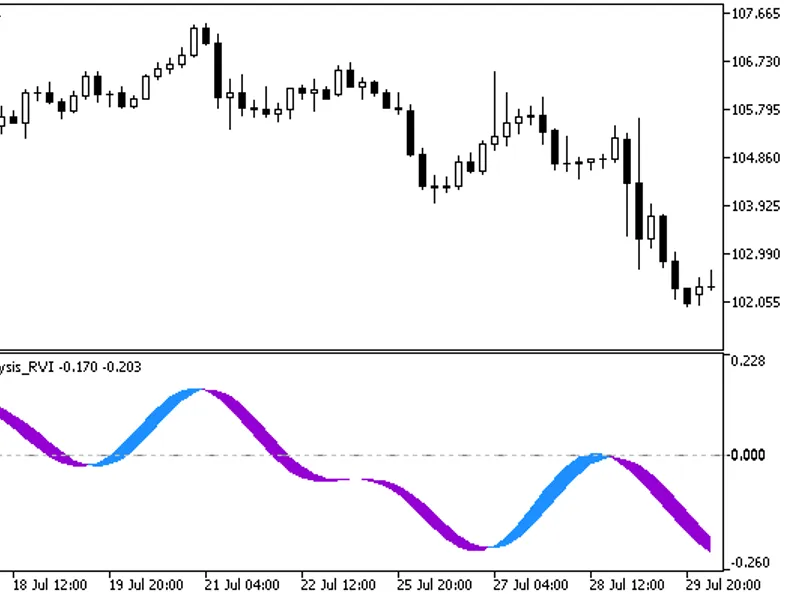
klotThe indicator smooths a time series of the RVI indicator by filtering harmonics of higher order.This approach can be used to smooth the values of any indicators, with the key b...
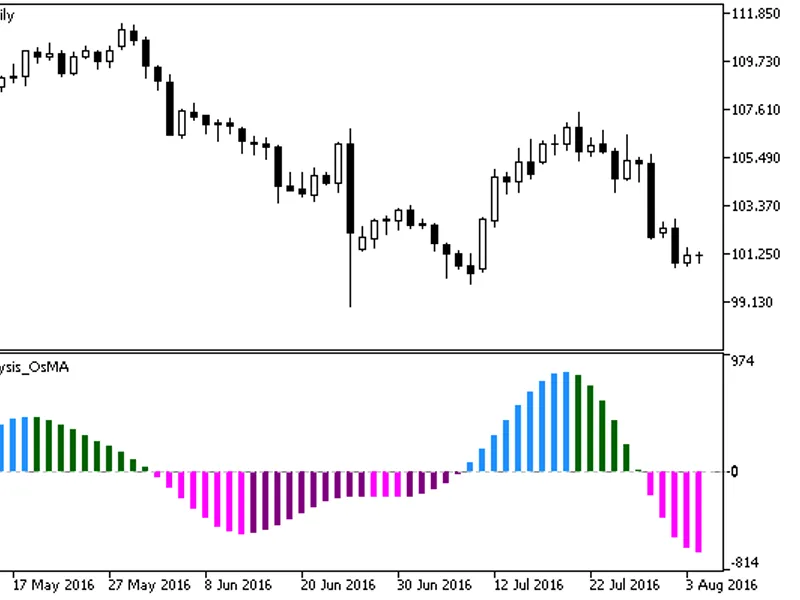
KlotThe indicator demonstrates the smoothing of a time series of the OSMA indicator by filtering higher-order harmonics.This technique can be utilized to smooth the values of vario...
The indicator with the timeframe selection option available in input parameters:The indicator requires Ravi.mq5 indicator file. Place it in \mql5\indicators.Fig.1. The Ravi_HTF ind...
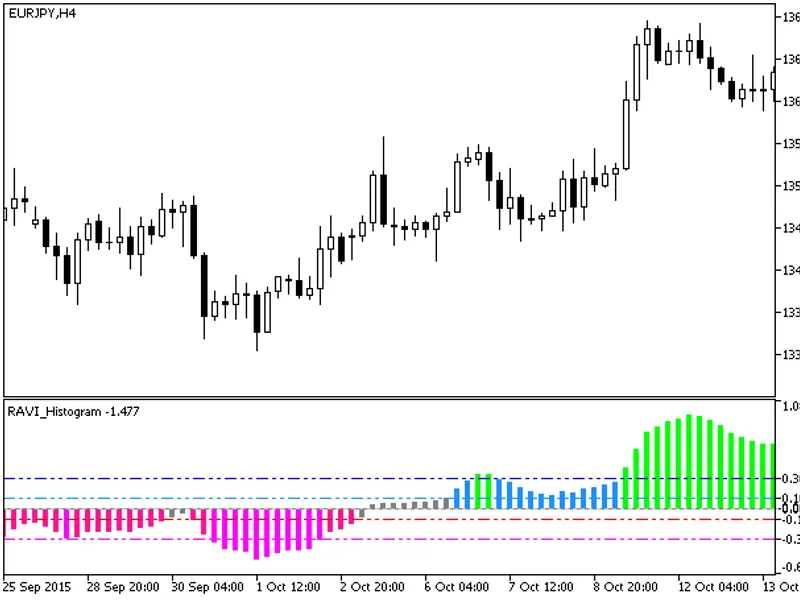
UnknownThe indicator is implemented as a histogram of the strength and direction of the current trend. The histogram is colored according to the values of input parameters for brea...
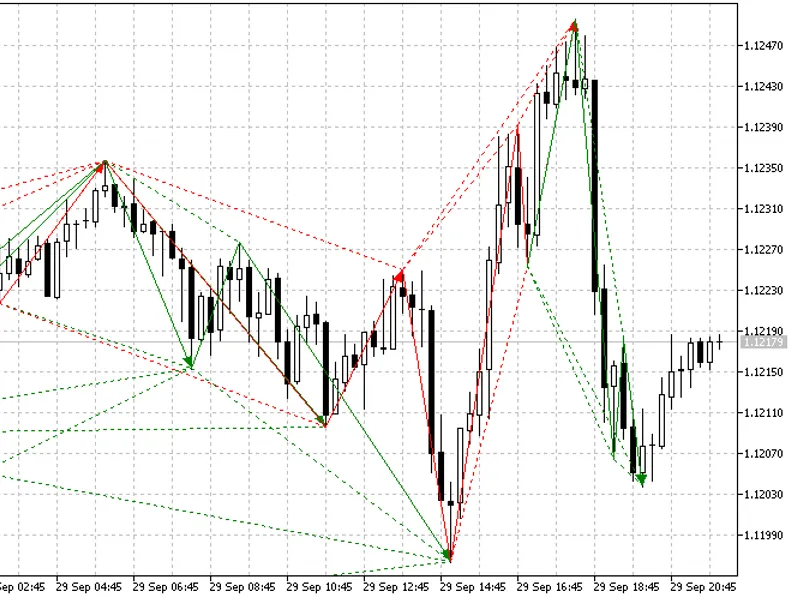
This indicator is designed to assist traders by automatically identifying and displaying harmonic patterns on charts. Harmonic patterns are characterized by 5 price extrema and spe...
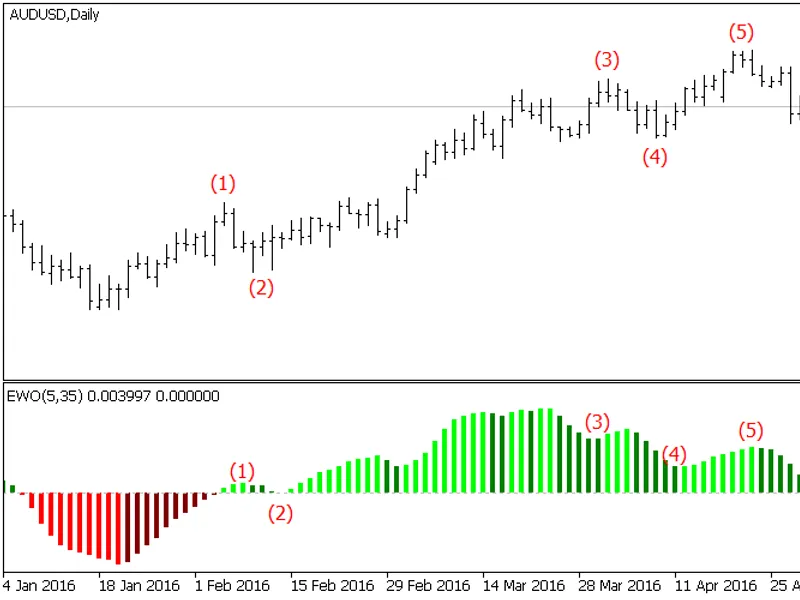
This comprehensive indicator suite, named 'Elliott Wave Oscillator', is tailored for MetaTrader platforms (MT4/MT5). It offers a reliable and user-friendly experience, adhering to ...
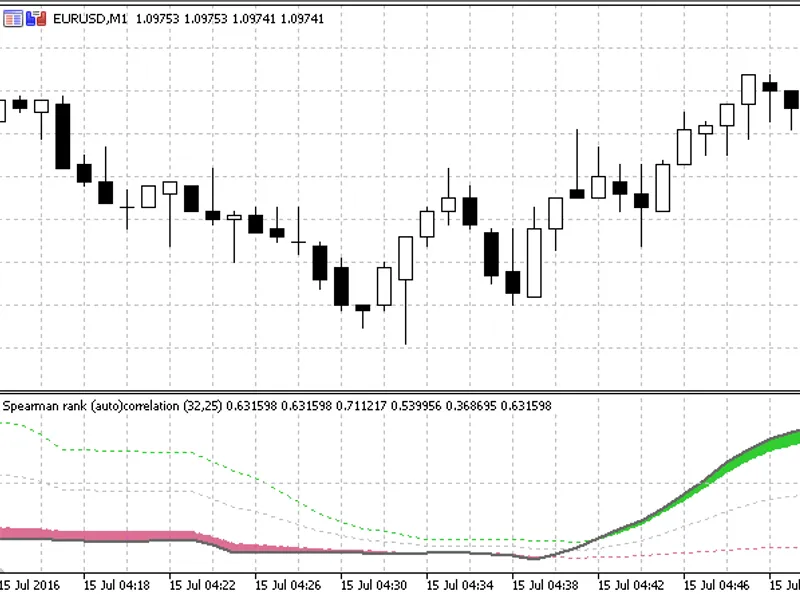
This is a rank (auto)correlation indicator that includes:Spearman Rank CorrelationPearson CorrelationIt offers flexibility with 22 types of prices and allows users to choose betwee...
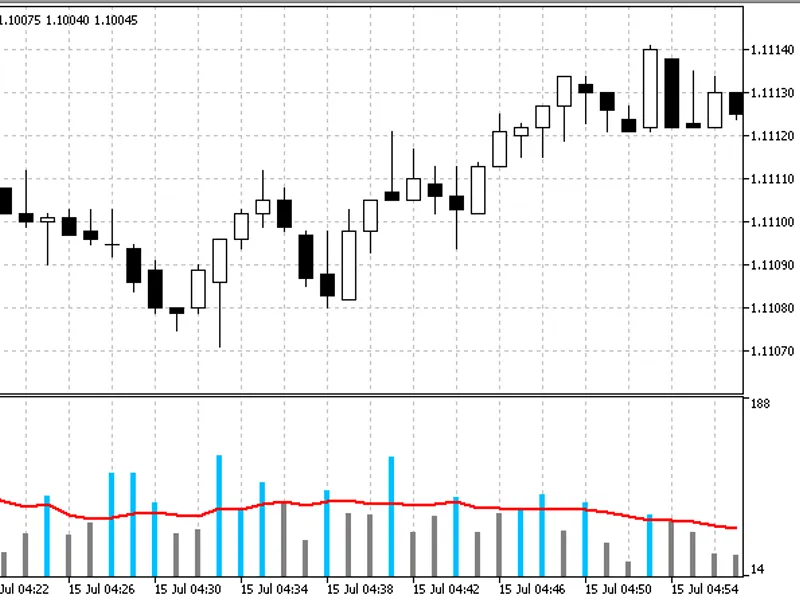
A simple volume indicator with two coloring modes:- Color change on average volume cross(es)- Color change based on the bull/bear state of the corresponding price candleRequires th...
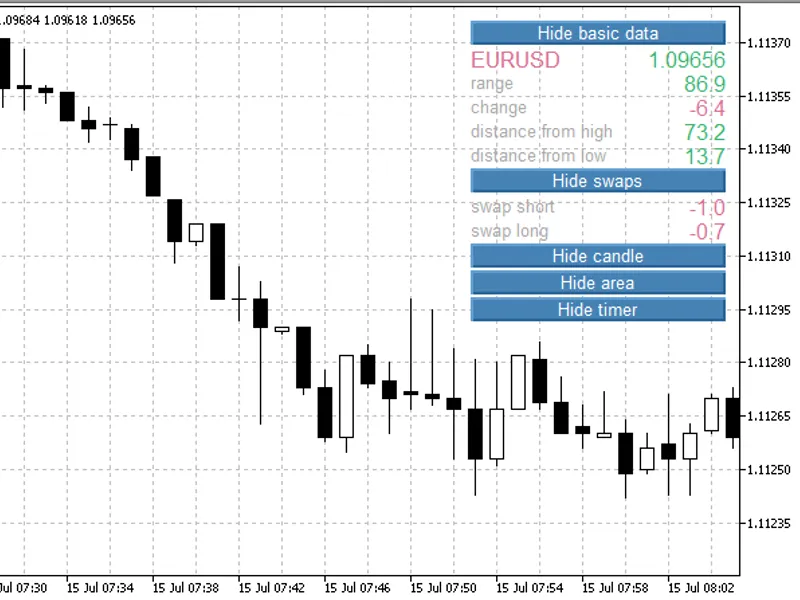
The indicator provides essential information on the current symbol in the chart window. It offers an interactive feature, allowing users to hide or reveal specific data by clicking...
The Gann High Low Activator indicator is a simple moving average (SMA) of the previous N period's highs or lows. It was featured in a 2026 issue of Stocks & Commodities magazine.Th...
The concept behind this indicator is to create a versatile moving average that can adapt and mimic various other moving averages.Key features:- Smoothness: The indicator ensures a ...
This is an enhanced Jurik Filter with a versatile application range, extending beyond prices to any indicator. The introduction of slope coloring significantly enhances its utility...
This powerful indicator offers a comprehensive set of features tailored for MetaTrader 4/5 platforms.Key Features:- Non-Repainting: Provides accurate, real-time data without lag or...
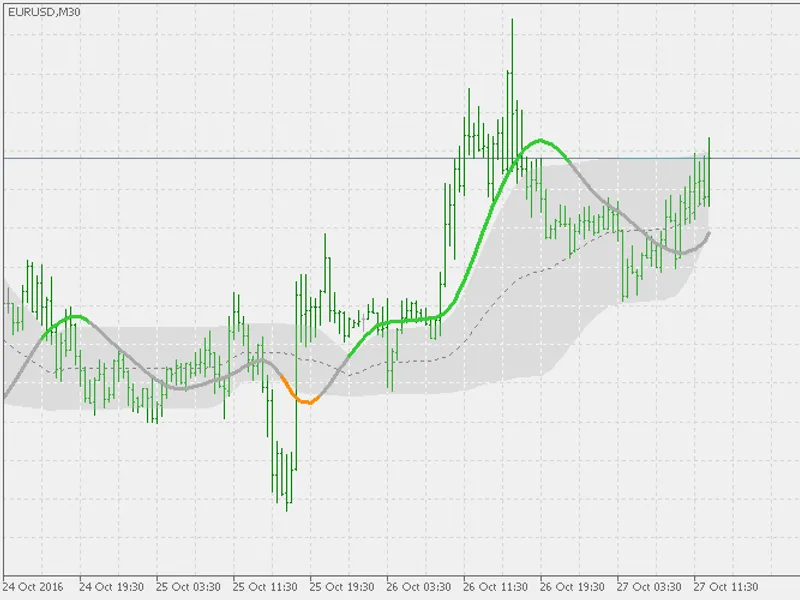
A unique twist on classical moving averages (MA) with color-coding based on the angle of the slope.The color-coding mechanism:- Steeper angles are closer to or equal to the 'fast u...
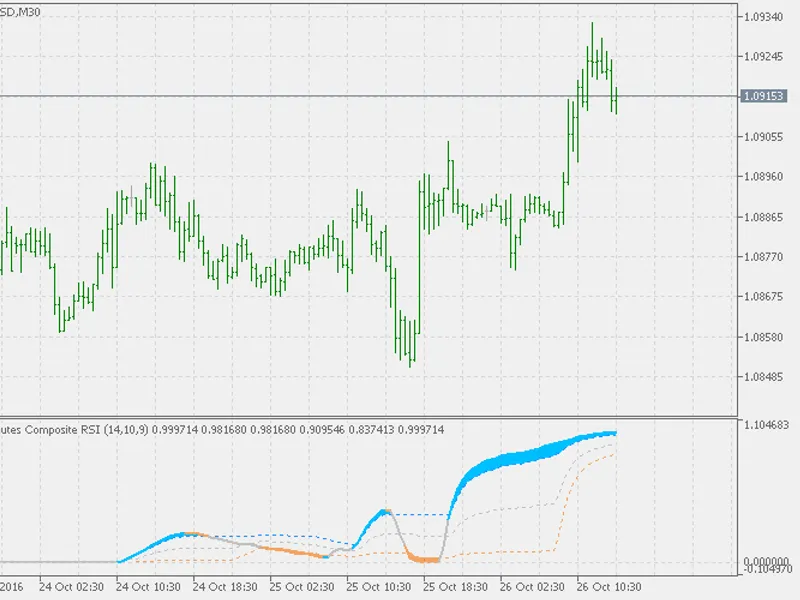
The Composite RSI is a unique indicator that offers a fresh perspective on market analysis.While its name might suggest a combination of multiple RSIs, it is, in fact, a novel appr...
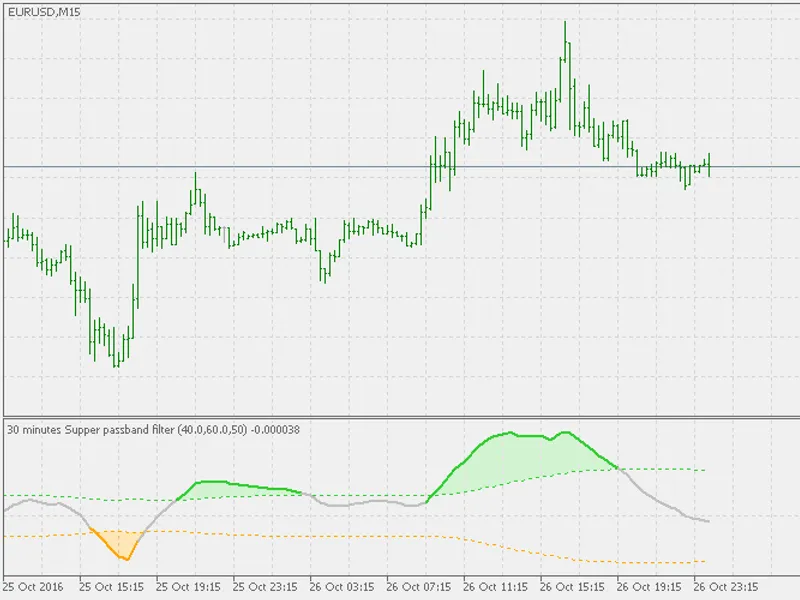
This indicator is based on John Ehlers' work, with a deviation that allows for different calculating periods. The default settings follow Ehlers' original parameters, but customiza...
T3 indicator utilizing floating levels to determine trend direction.This indicator employs an extended set of 22 price types and adapts its colors and alerts based on three conditi...
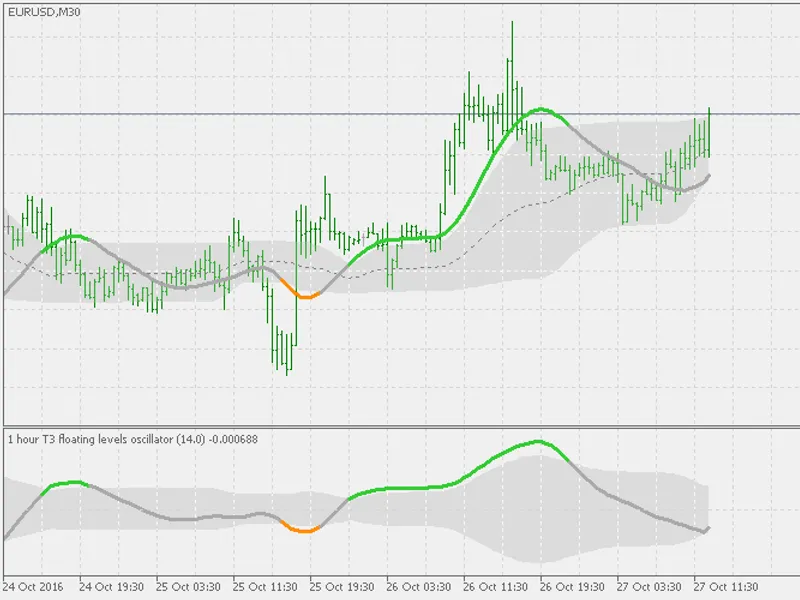
T3 indicator with floating levels, transformed into an oscillator.This indicator is an extension of the T3 Floating Levels indicator, designed to provide additional insights into t...
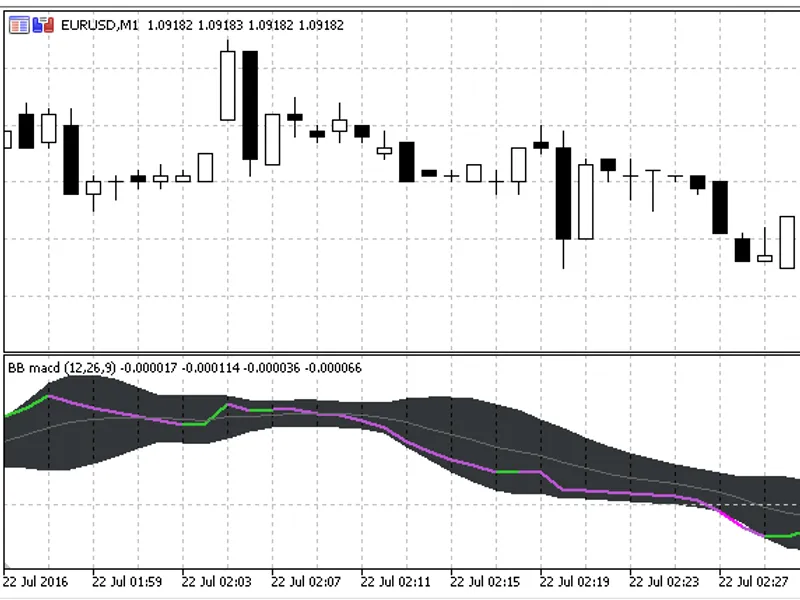
BB MACD is a MACD (Moving Average Convergence Divergence) indicator variation with an addition of Bollinger Bands, which aids in identifying trend change points and gauging the str...
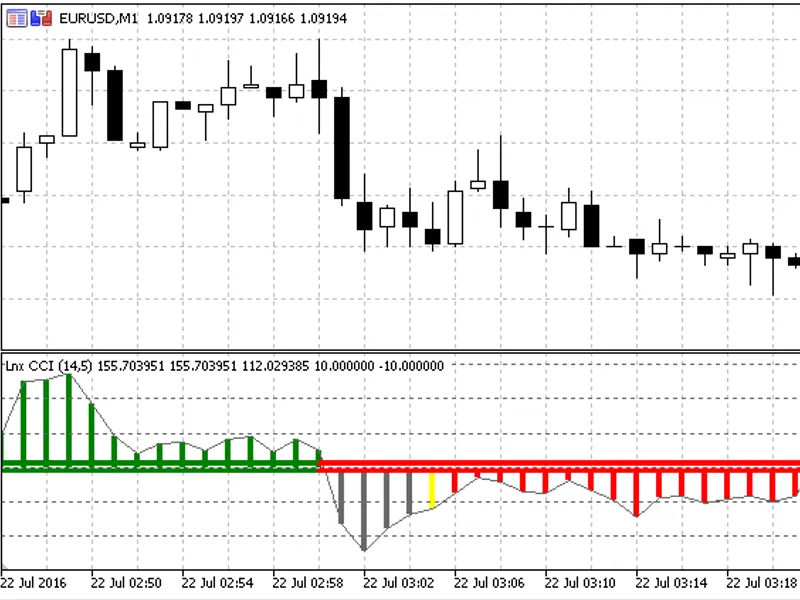
The Woodies CCI System is designed for trading primarily on 5-minute charts. The indicator is optimized for this specific time frame with its default settings.For usage on other ti...
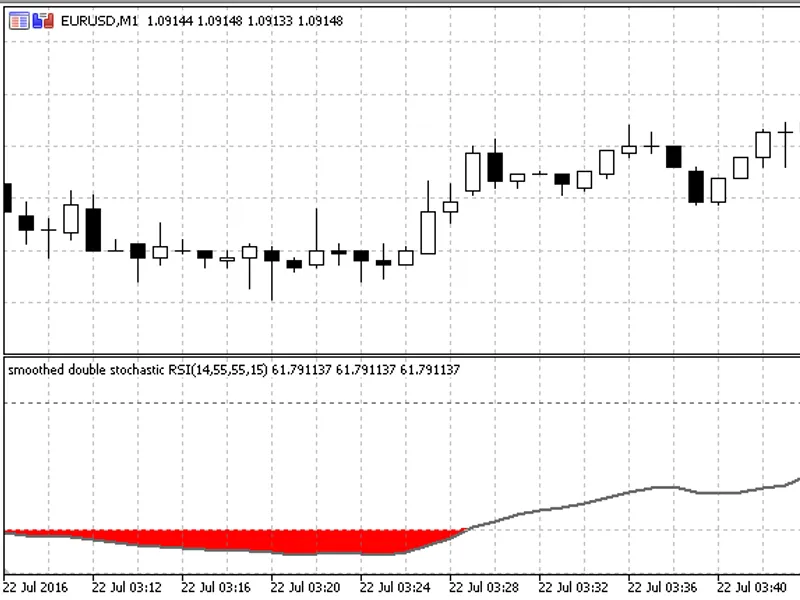
Stochastic RSI (sometimes referred to as DTOSC - Dynamic Trend Oscillator) is a technical indicator derived from the Relative Strength Index (RSI). It is essentially a stochastic v...
A variation on the T3 theme, this indicator creates envelopes using T3 for basic value instead of built-in averages. It functions similarly to standard envelopes, but remember that...
This indicator is an enhanced version of the classic Guppy Multiple Moving Averages (MM) indicator, updated for modern trading platforms.The original indicator was based on Exponen...
A unique indicator that calculates a stochastic and then applies the same calculation to the resulting data.This innovative approach provides an additional layer of analysis, offer...
A straightforward indicator designed to display the high and low values of a specified time frame on the current chart.This tool offers the flexibility to limit the display of high...
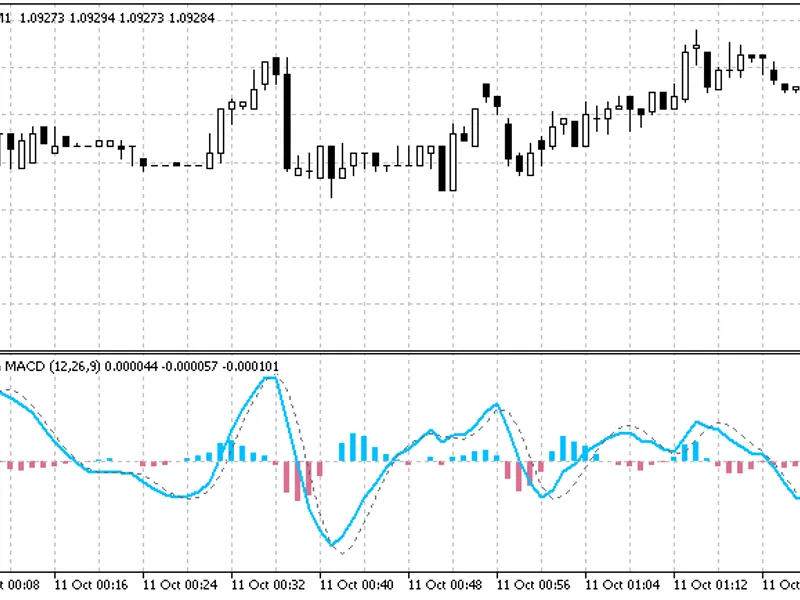
A variation of the MACD indicator that uses Nonlag MA for calculation, making it faster and more responsive.This indicator offers a unique approach by employing Nonlag MA for both ...
This indicator displays three T3s calculated based on the high, close, and low prices.The indicator features a unique color-coding system. When the upper two T3s have the same slop...