It happens sometimes when you've been creating and EA and you haven't noticed a bug that causes too many positions if not orders to be opened . or maybe there was a trade execution...
THE STORY BEHIND THIS TRADING TOOL: Most traders lose and this is a fact. There are lot of reasons behind their losses, but the main reason in my opinion is that they can't control...
Buy when the indicator line is green and sell when it turns red.The Fisher Transform indicator is an oscillator that helps to identify trend reversals and can be applied to any fin...
This indicator plots fibonacci channel on last swing high low that can be changed from input variable "ExtDepth"55 is a best parameter which is set by default. It plots a fibonacci...
It can download data once and be removed or update each 1-5-10 minutes. Since it is a service, it can always be active in the background without interfering with charts.32912008.08...
THE STORY BEHIND THIS TRADING TOOL: Most traders lose and this is a fact. There are lot of reasons behind their losses, but the main reason in my opinion is that they can't control...
After the three average lines are arranged completely according to high and low, it can be regarded as a trend formation. After the pattern is destroyed, the hatching is no longer ...
The HighPass-LowPass Roofing Filter was created by John Ehlers (Cycle Analytics For Traders pg.78)This is a variation of a roofing filter that will let you know which direction the...
This Expert Advisor demonstrates how to create and save graphic charts to a .bmp file from the MT5 Strategy Tester. The Graphic.mqh package (Include/Graphics/) is used. In MT4 this...
History mode to indicator. Set "historyMode" parameter to true then "double click" on any point in price chart to see Support and Resistance zones in that point, is done by Mr. Beh...
This free code manages to close all open positions complying with FIFO rules just by drag and drop into the chart, no matter if profit or loss.Must enable autotrading....
Basically margin required depends on the symbol attribute Margin Calc Mode and leverage depends on margin required. Calculaion details aare taken from the standard MQL5 help....
History:v 2.3 adds fixes, code improvement and Price-to-MA DistanceInformation:Trade Value depends on Price Positioning,the shape of which can be described also by MA Speed and Pri...
Nadaraya and Watson, both in 1964, proposed to estimate values as a locally weighted average, using a kernel as a weighting functionIt is producing a non-causal (re-calculating) sm...
This is the "Moving Average Bands" indicator with only one change compared to the original : you can chose the price (while in the original only close price is used)Recommendations...
Recommendations: It is not a directional indicator - it indicates volatility You can probably use it for indication of possible trend changes (after the lower extremes are reached...
John Ehlers introduced a variation of rsi calculation (as a part of another indicator) that he decided to call MyRSi. Since it produces results different then the built in rsi, it ...
In December 2020 issue of TASC, John Ehlers published an indicator called MyRsi with NET (MyRsi with Noise Elimination Technology) in which he uses a sort of Kendall (auto)correlat...
Original rex indicator (with an explanation what and how it is done) was posted here :Recommendations:you can use it the same way as any other rex indicator you can use the Donchia...
This indicator allows trader to calculate the proper lot size based on percentage risk and stop loss. The stop loss can be defined either using Average True Range ratio or Fixed si...
This indicator is one of the series of "experiments"even though it is named CCI, it is not actually CCI for that reason a sort of dynamic levels are added (a sort of Donchian chann...
In the December 2021 issue of TASC article “The DMH: An Improved Directional Movement Indicator”, John Ehlers explores a method of modernizing directional movement with Hann window...
Some of the digital filters in one place :Hanning Hamming Blackman Blackman / Harris And (simply in order to demonstrate that almost anything can be a digital filter) :rectangular ...
This is a variation of a digital filter using Hann windowing for filteringwith "speed up" factor set to 0, it is the same as original filter any speed up factor > 0 makes it a b...
On-balance volume (OBV) is a technical trading momentum indicator that uses volume flow to predict changes in stock price. Joseph Granville first developed the OBV metric in the 19...
As simple as it gets, channels based om high, low and ATR distances, Shows possible short term support / resistance or can be used as tp/sl in some trading systemsRecommendations: ...
This is the indicator originally posted here that is extended with a display of "states"."states" are displayed as colored histogram they can be calculated using :level 3 - outer ...
Based on the Austin Passamonte's idea , this indicator calculates pivots for any time frame (provided that the chosen time frame is higher than the chart time frame).Two modes of c...
The script is best use to clean up all drawings ( Delete All Object, Comment, horizontal line, vertical line, arrows etc) on current chart. Please feel free to modify based on your...
Description: Displays the current timeframe and symbol name in large font on the chart background. Useful when hopping between several charts with different symbols at the same tim...
iExposure will show the opening of trading positions in tabular form in the sub-window below the main window. This allows the trader to see at a glance the positions in the market ...
To calculate the average price, you can specify the periods H1 and D1. For example, the D1 average price allows you to track whether the price of a certain financial instrument is ...
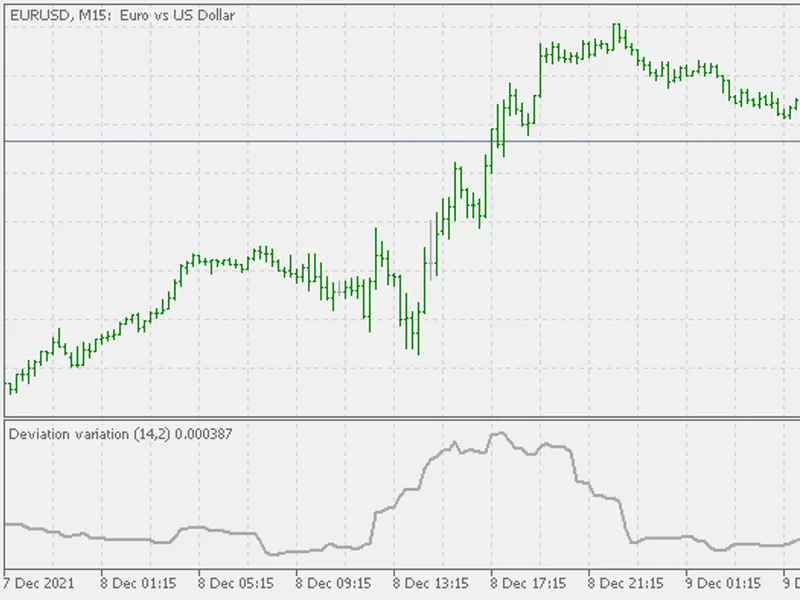
This is a variation on the standard deviationit is using momentum of price (instead price itself) for calculation it is calculated in a way that it takes minimal CPU load As far as...
As a quick example how momentum deviation (published here : ) can be used, this is a momentum deviation bands indicator (similar - but just similar - to Bollinger bands)Recommendat...
ZigZag Color Indicator for Line Charts which works on Close prices rather than High lowThis indicator has only one input parameter which is ExtDepth and its optimized for performan...
In his article in January 2022 issue of TASC, “(Yet Another) Improved RSI,” John Ehlers explains how he enhances the RSI by taking advantage of Hann windowing. The RSIH indicator p...