The indicator with the possibility to change the calculation timeframe using the indicator input parameters:For the indicator to operate, the ColorMFI_X20_Cloud.ex5indicator should...
The indicator implements a breakthrough system using the channel.When price exits the channel, the candlestick color changes to the color corresponding to trend direction. Blue is ...
Idea byThe Expert Advisor trades using the iMACD (Moving Average Convergence/Divergence, MACD) indicator signals.Signal generation rules:The EA only operates when a new bar appears...
The "Multi timeframes RSI" oscillator shows data of three RSI indicators from different timeframes on the current one.It has seven input parameters:RSI period- RSI calculation peri...
The "Multi Time Frame Power Weighted Moving Average" indicator shows the of different timeframes. data of three of different timeframes are displayed on the price chart.It has six ...
"Multi timeframe Slow Volume Strength Index" shows data of three indicators from different timeframes on the current chart.The indicator has nine adjustable parameters:EMA period- ...
The indicator with the ability to change the indicator timeframe using input parameters:For the indicator to operate, the Stalin.ex5indicator must be added to the <terminal_data...
Indicator with the timeframe selection option in its input parameters:For the indicator to operate, the Stalin_NRTR.ex5indicator should be added to the <terminal_data_directory&...
Trend Interruption Average displays three lines:the average number of consecutive rising candlestick Close prices (uptrend)the average number of consecutive falling candlestick Clo...
Average of 18 Moving Averages shows the average value of 18 different moving averages.It has two input parameters:Period - calculation period of each MA used in calculationApplied ...
Pivot Oscillator is based on three oscillators of average differences in typical prices.There are four input parameters:Fast MA period- fast moving average periodMedium MA period- ...
The Moving Average with step indicator.It has two input parameters:Period - calculation periodStep - step size The calculation is similar to a Simple Moving Average. However, some ...
Total Power is a power indicator. It displays three lines: Bulls power, bears power, and total power.It has two adjustable parameters:Power period- power calculation periodEMA peri...
"Average change price" displays the average change in the price value.It has three input parameters:Period - calculation periodMethod - calculation methodApplied price- price used ...
The BB ATR oscillator indicator shows an average true range based on Bollinger BandsIt has four adjustable parameters:ATR period- ATR calculation periodATR multiplier - ATR multipl...
Fx Sniper's Ergodic CCI Trigger is an ergodic CCI with triple smoothing, with a signal line.It has seven adjustable parameters:Period Q- Q smoothing periodPeriod R- R smoothing per...
JSmooth MA is a Moving Average by Mark Jurik.It has two adjustable parameters:Period - calculation periodApplied price- calculation priceCalculations:JSM = PrevJSM + A4where:A4 = (...
It has two adjustable parameters:Range - channel calculation rangeMA period- period of Moving Average Calculations:Highest= MaxLowest = MinMedian = (Max+Min) / 2MovAvg = SMA(Close,...
The On screen MACD indicator is drawn on the main price chart. Slow ЕМА is used as the zero line.It has four adjustable parameters:Fast EMA periodSlow EMA periodSignal period- sign...
Wilder ATR is an average true range by J. Welles WilderIt has two adjustable parameters:Period - calculation periodMethod - the method of smoothingCalculations:Wilder ATR = MA(TR, ...
The Wave Segregation Index (WSI) oscillator is based on the ratio of two indicators: ADX and CCI. It is displayed as a colored histogram.It has two adjustable parameters:CCI period...
TriMAgen is a Triangular Moving Average generalized by J.Ehlers.It has two input parameters:Period - calculation periodApplied price- price used for calculationsCalculation:TriMAge...
The OHLC Volume indicator divides volumes into two threads in accordance with Open/High/Low/Close of each bar.There are no input parameters.Calculation:StreamUP = Volume * UP_Coeff...
OHLC Volume Histogram displays the difference between two streams of the as a colored histogram.There are no input parameters.Calculation:Histogram = StreamUP - StreamDNwhere:Strea...
ROC with signal Moving Average oscillator indicator displays the Rate of Price Change and a signal line, which is calculated as a moving average of ROC data.It has three input para...
The Ultimate Oscillator indicator is based on three momentum indicators of different periods: week, two weeks and three weeks.It has five input parameters:First momentum period- fi...
The ZigZag Moving Average indicator builds a moving average using ZigZag reference points.It has three input parameters:ZigZag depth- the Depth parameter of the ZigZag indicator Zi...
The Intraday Intensity Open Form indicator.There are no input parameters.Calculation:Intensity = PrevIntensity + (2.0 * Close - High - Low) / Volwhere:Vol = (High - Low) * VolumeVo...
MA slope presents the slope of a Moving Average line. The indicator displays a colored Moving Average, the color of which depends on the point value of the MA slope between two key...
The MA Trend oscillator indicator statistically compares the position of a price relative to the MAs fan, which allows to identify the current market trend. Obtained data is displa...
Normalized Volume is an indicator showing the normalized volume value. It displays the average volume within the bars range, in the form of a colored histogram with a threshold val...
IdeabyThe Expert Advisor uses the custom indicator, which is a smoothed . Determine trend existence based on the indicator values on bars #0, #1, #2, #3 and #4:(StdDev #0 > StdD...
Two identical trading systems (for long and short positions) based on the signals of the indicator, which can be configured in different ways within one Expert Advisor. For this pu...
The indicator (Money Flow Index) applied over (Moving Average Convergence/Divergence) provides a visual presentation of the current price divergence.In addition to divergences, MAC...
The Expert Advisor will buy when the RSI indicator enters the oversold zone, and will sell when RSI enters the overbought zone.OpenBUY, OpenSELL — now you can configure only buy, o...
The EA compares yesterday's High and Low prices with the current day Close price. As soon as the current price breaks through yesterday's High or Low, immediately open a position. ...
The following settings are now available as input parameters:color of the indicator main linewidth of the indicator main linevalues of the two indicator levels What is the purpose ...
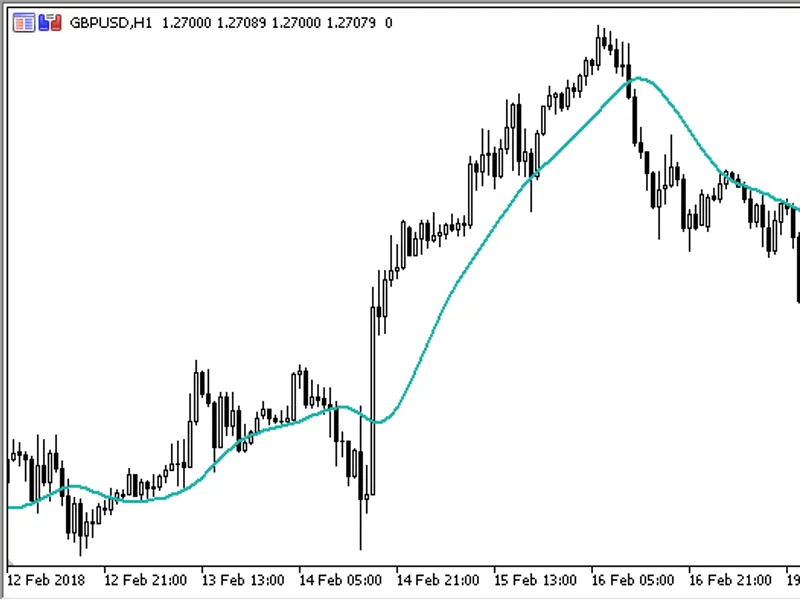
Two moving averages from different timeframes, drawn in a single window as a color cloud colored according to the trend direction.Fig.1. The X2MA_2HTF indicator...
Nick BilakA redrawing channel, which looks into the future by a certain amount of bars specified in the appropriate input parameterFig.1. The Super_Signals_Channel indicator...
Mods and stuff by Linuxser for Forex-TSDAn indicator of support and resistance channels.The original indicator was developed in the MQL4 language and published in the on 19.04.2008...
Two identical trading systems (for long and short deals) based on the indicator signals that can be configured in different ways within a single EA with an ability to change the vo...
Three indicators from different timeframes in a single window The X2MA_3HTFindicator is designed for an additional window and X2MA_3HTF_mainis used for the main window.Fig.1. Spear...
The oscillator implemented as a color histogram, using volumesCalculation formula:XFisher_org_v1_Vol = MovingAverage( 100 * Fisher * Volume ) In the indicator input parameters, the...
The indicator with the possibility to change the indicator timeframe using input parameters:To provide correct operation of the indicator, you should place the compiled XFisher_org...
The oscillator with additional indication in the form of colored squares at the zero level, when entering the overbought and oversold zones in the trend direction.The indicator use...