Extent oscillator displays the difference between the moving average and the price as a colored histogram.It has four inputs:MA period- moving average calculation periodMA type- mo...
'Specified time range candles' indicator displays colored candles at a specified time interval (trading session) on the price chart. Candles not falling within the specified range ...
The EA opens only one position at a time, therefore it is able to work both on hedging and netting accounts. It works on every tick. Trading is completely disabled on Friday.BUY si...
CCI Bar signal indicator. The indicator displays the colored diagram of CCI indicator status relative to its oversold/overbought levels (above/below/upward crossing/downward crossi...
indicator with the timeframe selection option available in input parameters:For the indicator to operate, the SpearmanRankCorrelation_Histogram.ex5indicator should be added to the ...
Input parameters for activating signals: The indicator uses the OneSideGaussian.mqhGaussian algorithms library (should be copied to the terminal_data_folder\MQL5\Include).Fig. 1. S...
indicator with the timeframe selection option available in input parameters:For the indicator to operate, the SR-RateIndicator.ex5indicator should be added to the <terminal_data...
The EA analyzes candles #1 and #2.Example of opening and closing for SELLOpen conditions - there is no a single position on the marketIf there is an open position, check the close ...
The indicator plots one vertical line per month in a specified moment of time. Lines are drawn using indicator buffers and graphical construction type. It is recommended to place t...
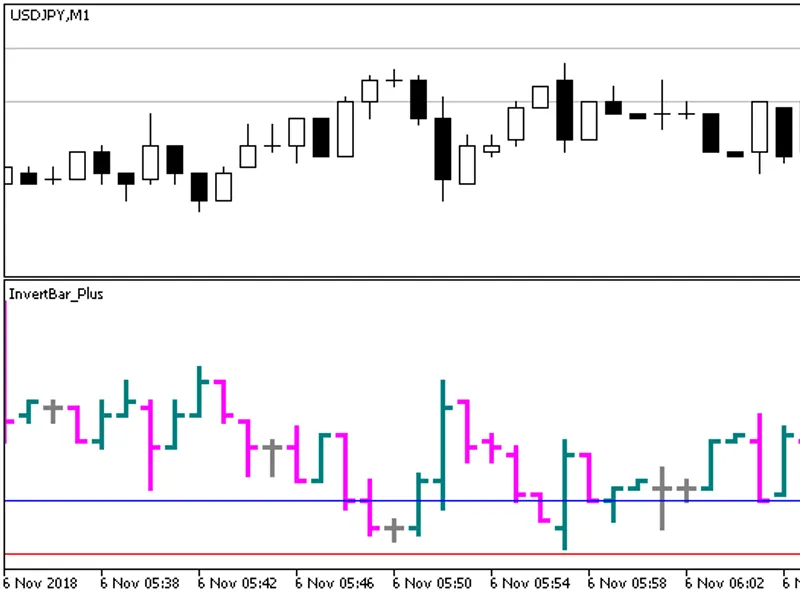
The inverted chart of the current financial instrument, displaying Ask and Bid price levels in the form of colored bars in the additional window.Fig. 1. Bar_Plus indicator...
The EA uses iAC (Acceleration/Deceleration, Accelerator/Decelerator Oscillator, AC) indicator. The EA only operates when a new bar appears. The EA opens only one position at a time...
The Expert Asvisor uses iCCI (Commodity Channel Index, CCI) and iWPR (Williams’ Percent Range, %R) indicators, as well as custom indicator. You can open opposite positions, therefo...
The EA uses iCCI (Commodity Channel Index, CCI) and iMA (Moving Average, MA) indicators.When MA shows growth, iCCI indicator is running: -100 to buy and 200 to sell!When MA shows f...
This is a simple Expert Advisor using two indicators: iMA (Moving Average, MA) and iMACD (Moving Average Convergence/Divergence, MACD). The EA opens only one position at a time, th...
The EA uses iSAR (Parabolic SAR) indicator signals on the Bar currentbar from the Work timeframe. The EA opens only one position at a time, therefore it is able to work both on hed...
The EA opens only one position at a time, therefore it is able to work both on hedging and netting accounts. The EA only operates when a new bar appears. The robot focuses on iADX ...
indicator featuring background filling in overbought/oversold areas. Filling size and position are adjustable by inputsWhen launching the indicator, you can change the style and co...
indicator featuring background filling in overbought/oversold areas. Filling size and position are adjustable by inputsWhen launching the indicator, you can change the style and co...
indicator is able to color each line depending on its position relative to overbought and oversold areas. When launching the indicator, you can change the style and color of only t...
The indicator plots one vertical line per day in a specified moment of time once per week. Lines are drawn using indicator buffers and graphical construction type. It is recommende...
Wick length indicator displays the candle wick length in points in a separate chart window.It has one configurable parameter:Method - display methodSeparated - separateSeparated Op...
Vortex Trend signal indicator. The indicator is based on indicator. It displays the colored diagram of the trend direction in a separate chart window.There are five inputs:Vortex p...
'Since last fractal' displays the number of bars passed since the last fractal formation in a separate chart window. Two lines: one displays the number of bars after the upper frac...
Market Meanness Index indicator is a business activity index. It displays the market state - trend or random (chaotic).The indicator has three input parameters:Period - calculation...
Whistler's Active Volatility Energy - Price Mass indicator. The indicator was described in the book "Volatility illuminated" by Mark Whistler.The indicator has twelve input paramet...
NOTE: The EA can be used only on hedging accounts! The EA applies OHLC analysis, standard iMA (Moving Average, MA) and iRSI (Relative Strength Index, RSI) indicators, as well as cu...
Consensus of Five signal indicator. The indicator is based on the readings of five indicators: ADX, DMI, CCI, MACD and Stochastic.DMI, CCI, MACD and Stochastic indicator directions...
The indicator plots one vertical line per day in a specified moment of time. Lines are drawn using indicator buffers and graphical construction type. It is recommended to place the...
The EA only operates when a new bar appears. It always keeps open no more than one open position - therefore it can work both on netting and hedging accounts.The algorithm itself i...
The following characteristics were made input parameters:color of the indicator main linewidth of the indicator main linevalues of the two indicator levels Why was this done When t...
The EA applies custom indicator, which allows correct display of WPR levels (Value Level #1 and WPR: Value Level #2) during a visual testThe EA only operates when a new bar appears...
The with the timeframe selection option available in its input parameters:For the indicator to operate, the Volatility2Step_Alerts.ex5indicator should be added to the <terminal_...
Input parameters for activating signals: Fig. 1. Volatility2Step_Alerts. The indicator exceeds the threshold value on a zero barFig. 2. Volatility2Step_Alerts. Activating an alert...
The indicator displays two lines (DRAW_LINE display style). You can select the prices (Open, High, Low or Close) each line should be based onAs a result, we have a channel consisti...
Eva RuftA simple indicator that calculates rounded volatility of a financial asset. Volatility is calculated in points based on the maximum and minimum prices.The volatility is cal...
The EA contains five strategies:by iADX indicator (Average Directional Movement Index, ADX) by iMA (Moving Average, MA) and iStochastic (Stochastic Oscillator) indicators by iMACD ...
T3 Price Overlay indicator displays two calculated by High and Low prices and colored candles extending beyond the moving average lines.It has two configurable parameters:T3 period...
Highly Adaptable Moving Average Alert displays the channel built using any of the eighteen moving averages. When the price crosses extreme and central channel lines, a signal point...
Elder's Safe Zone Triple indicator is Alexander Elder's safe zone. Unlike , the indicator is able to display three lines with different settings. The indicator calculates the minim...
Elder's Safe Zone indicator is Alexander Elder's safe zone. The indicator calculates the minimum stop loss size, so that it is not far from the price for maintaining profit, and no...
Ehler's Center of Gravity indicator is FIRfilter by John Ehlers applied to a price. It is the result of Ehlers' analysis of adaptive filters. "Gravity center" has zero lag that ena...
There are sixteen customizable parameters:Hours offset- zero hour shiftShow days numbers- display date number next to week day name (Yes/No)Day label color- week day name label col...