Forecast
This professional-grade solution for MetaTrader 5 helps traders achieve greater efficiency in their daily workflow. This technical indicator acts as a specialized analysis tool designed to visualize market data. It helps traders identify emerging trends, momentum shifts, and key support or resistance levels by plotting statistical calculations directly onto price charts.
How to Setup and Use Forecast
1. Installation: Place your file in the MQL/Indicators folder via "Open Data Folder" and restart your terminal.
2. Loading: Find the indicator in the Navigator, drag it onto your chart, and configure the input parameters in the popup window.
3. Customization: Press Ctrl+I to open the indicator list, select your tool, and click "Properties" to change colors, levels, or visual styles.
4. Updating: Replace the old file in the Indicators folder with the new version and restart the platform to apply changes.
Frequently Asked Questions
Q: Why is my indicator not showing? A: Verify the file is in the MQL/Indicators folder, or try right-clicking the "Indicators" tree in the Navigator and clicking "Refresh."
Q: Do custom indicators slow down the platform? A: Too many complex indicators can impact performance; remove unused ones via the "Indicator List" (Ctrl+I).
Q: Can I use MT4 indicators on MT5? A: No, MQL4 and MQL5 are distinct languages; ensure the indicator is compiled specifically for your platform version.
Description & Settings
Forecast oscillator was developed by Tushar Chande and is the continuation of his "Time Frame Forecast" method.
The indicator has three input parameters:
Period - calculation period
Applied price - calculation price
Signal period - signal SMA period
The Time Frame Forecast method is calculated inside the indicator and does not require the use of additional indicators.
Calculation:
Interpretation:
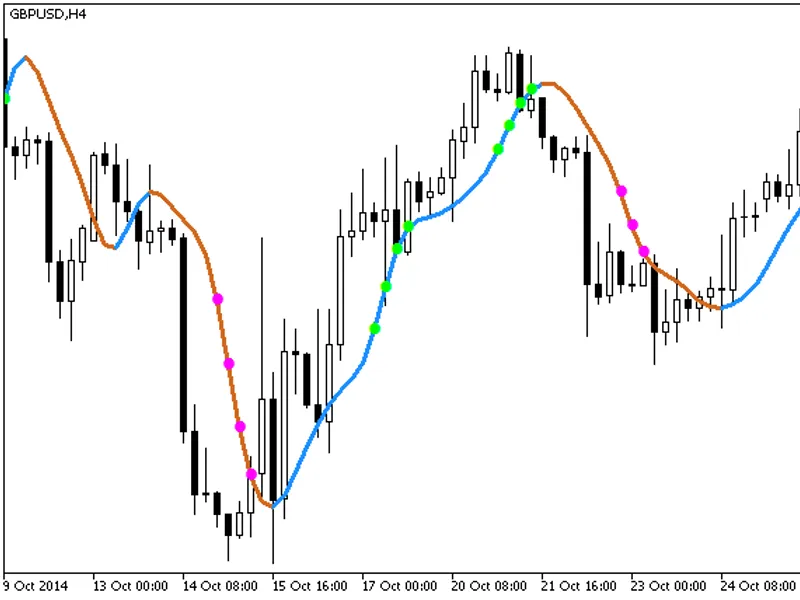
Positive indicator values predict a price growth. Negative values suggest the price may fall. Tushar Chande also recommends using a 3-day smoothing line as a signal line. When the oscillator line is accelerated relative to the signal line or crosses it, this indicates either stopping of the price movement (reversal or intersection opposite to the signal line movement), or a continuation of movement in the same direction (reversal or intersection in the direction of the signal line movement), or a forthcoming trend change (needs to be confirmed by the intersection of the oscillator's zero value). Data interpretation depends on the position of the oscillator line, i.e. whether it is above or below zero.