A channel formed by two Double Exponential Moving Averages based on averaged High and Low timeseries. Candlesticks beyond the channel are marked with the trend-related color. Candl...
Almost every trader used or at least took a look at Gerald Appel's MACD. Looking at our Old Bag of Tricks we rescued a technique several traders used/use which is adding additional...
Indicator that is checking for intra-day channel values and breakouts of those channels.The time segment that is used for channel is specified by the parameters, and then it is use...
Floating levels are used for that and that way the indicator is not depending on any kind of fixed levels, which makes the indicator a sort of an adaptive indicator. Some experimen...
indicator made as "binary".Having only two values (+1 for "trend" up and -1 for "trend" down) makes it suitable for usage from experts (where usually only two states are what we ar...
Heiken Ashi is a very well known indicator.Instead of using "raw" prices" for calculations, it's using smoothed/filtered/averaged prices instead. That usually filters out some fals...
Heiken Ashi is a very well known indicator.Instead of using "raw" prices" for calculations, it's using smoothed/filtered/averaged prices instead. That usually filters out some fals...
This indicator is a variation of a well known WPR (Williams Percent Range) indicator.It is calculating a sort of 4 WPR values:WPR of Open. WPR of Close. WPR of High. WPR of Low. Th...
Indicator is based on the "In The Volume Zone" article by Walid Khalil and David Steckler.An axiom of technical analysis states that with few exceptions, all technical indicators c...
Indicator is based on the "In The Volume Zone" article by Walid Khalil and David Steckler.An axiom of technical analysis states that with few exceptions, all technical indicators c...
The QQE (Quantitative Qualitative Estimator) indicator consists of a smoothed Relative Strength Index (RSI) indicator and two volatility-based trailing levels (fast and slow)....
The QQE (Quantitative Qualitative Estimator) indicator consists of a smoothed Relative Strength Index (RSI) indicator and two volatility-based trailing levels (fast and slow).Fixed...
The QQE (Quantitative Qualitative Estimator) indicator consists of a smoothed Relative Strength Index (RSI) indicator and two volatility-based trailing levels (fast and slow).The F...
The QQE (Quantitative Qualitative Estimator) indicator consists of a smoothed Relative Strength Index (RSI) indicator and two volatility-based trailing levels (fast and slow).Fixed...
The QQE (Quantitative Qualitative Estimator) indicator consists of a smoothed Relative Strength Index (RSI) indicator and two volatility-based trailing levels (fast and slow)....
The Random Walk Index (RWI) is a technical indicator that attempts to determine if a stock's price movement is of random nature or a result of a statistically significant trend.The...
The Random Walk Index (RWI) is a technical indicator that attempts to determine if a stock's price movement is of random nature or a result of a statistically significant trend.The...
Choppiness Index: another way of calculating fractal dimension.Choppiness Choppiness is a modern indicator based on ideas of chaos theory and fractal geometry. Benoit Mandelbrot wa...
Choppiness Index: another way of calculating fractal dimension.Choppiness Choppiness is a modern indicator based on ideas of chaos theory and fractal geometry. Benoit Mandelbrot wa...
In order to make the volatility assessment easier, this indicator is producing smoothed results. Also, in order to avoid adding significant lag, the usual "trick" to avoid that lag...
Indicator that checks slopes of 5 (different period) Least Squares Moving Averages (LSMA or linear regression value) and adds them up to show overall trend....
Indicator that checks slopes of 5 (different period) averages and adds them up to show overall trend.Averages that can be used in this indicator are the:Simple Moving Average (SMA)...
Indicator that checks slopes of 5 (different period) T3 Moving Averages and adds them up to show overall trend.You can chose between the two know T3 types:Original Tim Tillson T3 c...
Henderson's Filter for MetaTrader 5. According to a brief description:PS: be aware that Henderson's filters are from a family of centered smoothers, i.e. they recalculate half peri...
Price Zone Oscillator indicator is based on the "Entering the Price Zone" article by Walid Khalil and David Steckler.In our last article, we introduced a new oscillator that provid...
Price Zone Oscillator indicator is based on the "Entering the Price Zone" article by Walid Khalil and David Steckler.In our last article, we introduced a new oscillator that provid...
Some indicators are working equal for all calculation lengths some are not. One example that is not is RSI. Even though it is taken for granted that it oscillates in 0-100 range (s...
tends to be "nervous" (the direction of the RSI itself, and of the normalized RSI as a result is changing sometimes erratically).PS: if the normalization period is set to <=1, t...
The script exports history of closed positions from MT5 retail hedging account selected between two dates. The resulting file is CSV that can be opened/imported with any spreadshee...
By definition Elliot Oscillator is a "34 period Simple Moving Average of prices subtracted from a 5 period Simple Moving Average of prices displayed as a histogram above and below ...
What is it actually? It is a standard deviation indicator that shows if the deviation is below or above some fixed level. That way it can show if the volatility is increased or not...
Trend Trigger Factor was described by M.H. Pee in the Technical Analysis of Stocks and Commodities magazine in December, 2004.Next higher timeframe: first higher timeframe compared...
Trend Trigger Factor was described by M.H. Pee in the Technical Analysis of Stocks and Commodities magazine in December, 2004.Next higher timeframe: first higher timeframe compared...
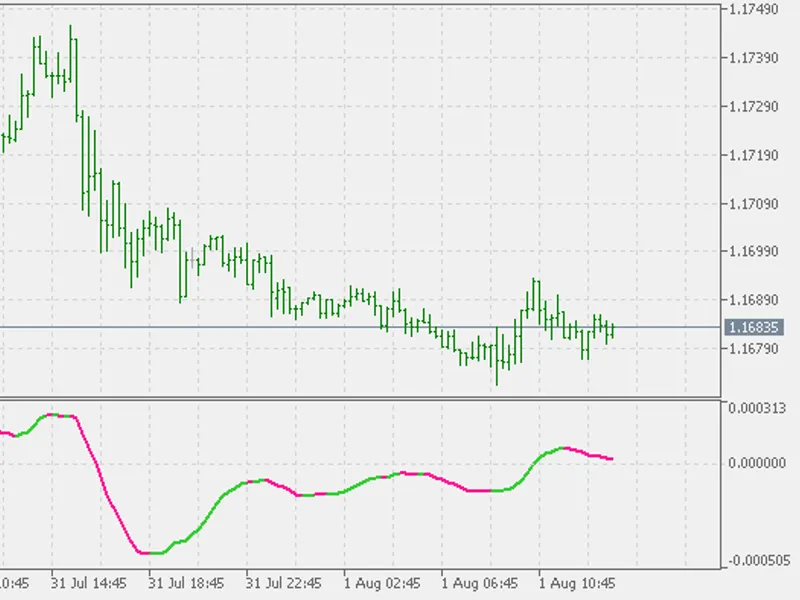
TRIX is a momentum oscillator that displays the percent rate of change of a Triple Exponentially Smoothed Moving Average. It was developed in the early 1980's by Jack Hutson, an ed...
TRIX is a momentum oscillator that displays the percent rate of change of a Triple Exponentially Smoothed Moving Average. It was developed in the early 1980's by Jack Hutson, an ed...
TRIX is a momentum oscillator that displays the percent rate of change of a Triple Exponentially Smoothed Moving Average. It was developed in the early 1980's by Jack Hutson, an ed...