RS I Bollinger Bands EA
This is a powerful addition to your MetaTrader 5 toolkit designed to optimize market analysis and performance. This Expert Advisor serves as automated trading software. It is utilized to monitor financial markets and execute trades based on predefined algorithmic rules, enabling precise position management without the need for constant manual oversight.
How to Setup and Use RS I Bollinger Bands EA
1. Installation: Open the "File" menu, select "Open Data Folder," navigate to MQL/Experts, paste your file, and restart the terminal.
2. Activation: Drag the EA from the Navigator onto a chart, ensure "Allow live trading" is checked in the Common tab, and verify the AutoTrading button is green.
3. Optimization: Right-click your chart, choose "Expert List," click "Properties" to adjust inputs, and save your preferred setup as a set file for future use.
4. Maintenance: Regularly check the "Experts" tab in the terminal window to monitor trade logs and potential execution errors.
Frequently Asked Questions
Q: Why is my EA not opening trades? A: Check the "AutoTrading" button, ensure "Allow live trading" is enabled, and verify your broker allows automated trading on your account type.
Q: Can I run multiple EAs on one chart? A: No, each chart can only host one active EA; however, you can open multiple charts for different currency pairs to run several EAs.
Q: What does the "smiley face" icon mean? A: A smiley face in the top-right corner of the chart indicates the EA is successfully running; a frowny face means it is disabled.
Description & Settings
Idea by
: .
MQL5 code by
: .
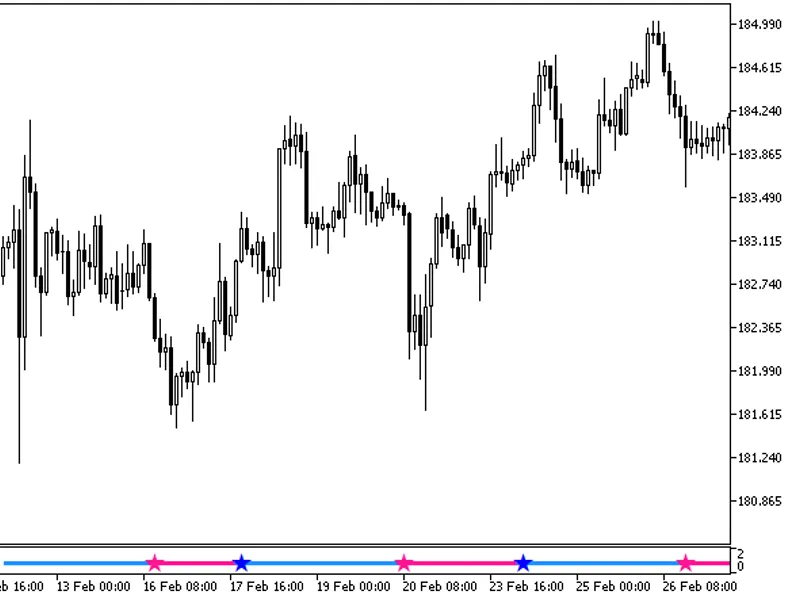
The program uses the overbought (OB) and oversold (OS) zones, for which it generates trading signals for selling or buying. OB and OS are determined on M15, H1, and H4. To demonstrate the program, the EURUSD M15 chart was chosen.
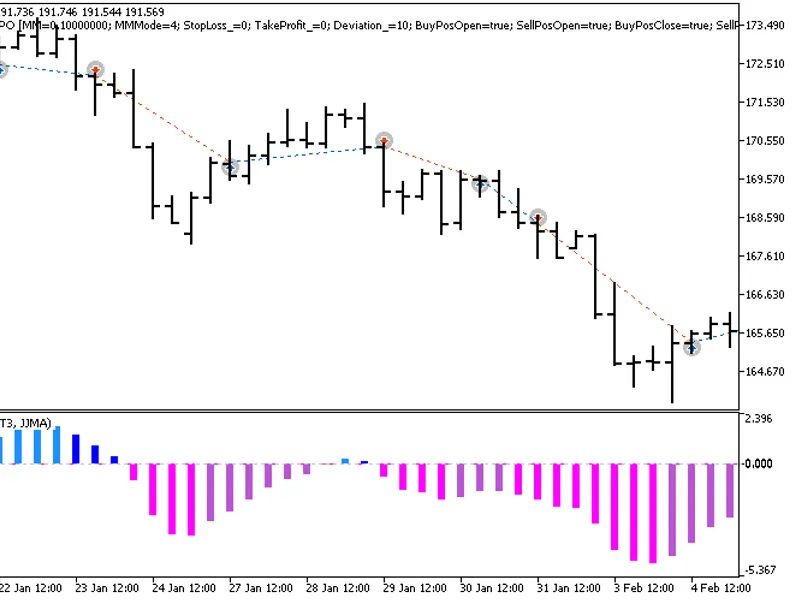
The program has to triggers to show the comparison of alternative methods to determine OB/OS.
The first trigger is the conventional method that uses fixed figures to determine the RSI overbought/oversold zones. The OB and OS zones begin with the typical RSI levels with the values of 70 and 30.
Trigger No. 2 places Bollinger Bands around the average RSI for a certain period of time. The OB and OS zones are determined as the levels of standard deviation from the average RSI. For example, the overbought signal will be a state where the RSI value is higher than RSI_Upper, where RSI_Upper = RSI_Sigma*StdDev + RSI_Avg. In this expression, RSI_Sigma is the dispersion level, and standard deviation (StdDev) is calculated from the RSI distribution on the last bars.
As you can see from the two Strategy Tester reports attached below, trigger No. 2 (by the Bollinger Bands method) shows good results for the testing period of over 11 years and is superior to trigger No. 1. Moreover, trigger No.2 works more evenly and shows much lower dispersion of the results than trigger No. 1 on M15 over 11 years.