


three-line break charts explained
Info
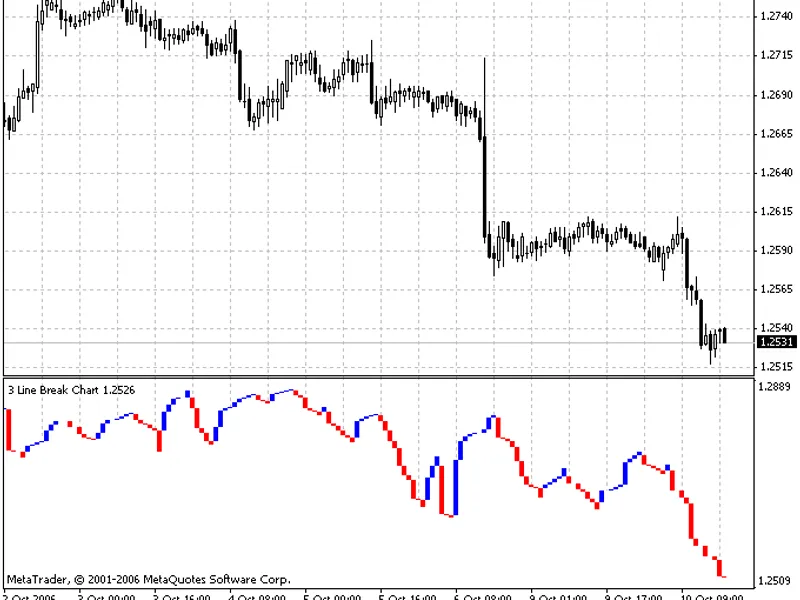
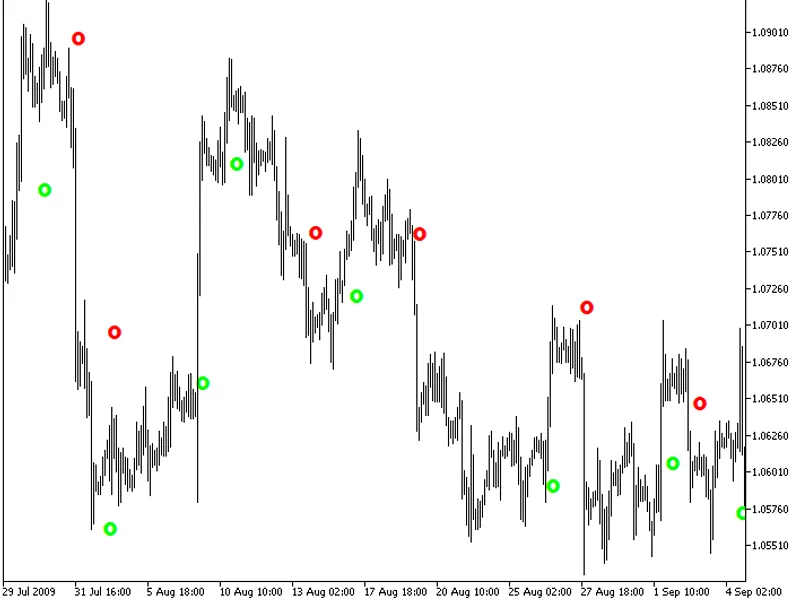
The three-line break charts explained is a Script for MetaTrader 4 that three-line break charts are a graphical representation consisting of vertical rectangles whose height is determined by price changes. similar to kagi, point & figure, and renko charts, they do not incorporate the time factor.
Usage
This tool is typically used for enhancing chart analysis and decision making.
Platform
This Script works exclusively on MetaTrader 4 (both build 600+ and newer versions).
Setup
Place the downloaded file in MQL4/Scripts folder via File ? Open Data Folder in MetaTrader 4.
How to Install and Use three-line break charts explained
1. Installation: Move your script file into the MQL/Scripts directory and restart the platform.
2. Execution: Drag the script onto a chart; it will perform a one-time action, such as closing all open orders or clearing chart objects.
3. Editing: Use MetaEditor (F4) to modify code, click "Compile," and verify no errors appear in the terminal before running.
4. Removing: Scripts stop automatically, but you can remove them manually by right-clicking the chart and choosing "Remove Script."
Frequently Asked Questions
Q: How are scripts different from EAs? A: Scripts execute a single action and then stop; EAs monitor the market and trade continuously.
Q: Can I assign a hotkey to a script? A: Yes, right-click the script in the Navigator, select "Set Hotkey," and define your preferred keyboard shortcut.
Q: Why did my script stop? A: Scripts are designed to stop immediately after finishing their programmed command; this is normal behavior.
What this tool does
three-line break charts are a graphical representation consisting of vertical rectangles whose height is determined by price changes.
Typical Use Case
This Script excels in automated trading and technical analysis on MetaTrader 4.
Compatible Platform & Setup
This Script works on MetaTrader 4. Place the file in the MQL4/Scripts folder and restart the terminal.
Description & Settings
Related: Mod Stop Reverse EA with Trailing Orders and Break-Even Levels - another powerful script for MetaTrader 4 traders.
three-line break charts are a graphical representation consisting of vertical rectangles whose height is determined by price changes. similar to kagi, point & figure, and renko charts, they do not incorporate the time factor. this charting method is named after the number of lines typically used to signal a reversal.Also recommended: break trend indicator - similar script with strong performance on MetaTrader 4.
the basic rules for trading with a three-line break chart are as follows:
buy when a blue line appears after three consecutive red lines (indicating a potential uptrend reversal).
sell when a red line appears after three consecutive blue lines (indicating a potential downtrend reversal).
avoid trading when there is no clear trend, characterized by alternating blue and red lines.
a key advantage of three-line break charts is that reversal criteria are not arbitrarily set; the price action itself dictates reversals. a potential disadvantage is that reversal signals might appear after a new trend has already begun. however, many traders accept this to capture a larger portion of a significant trend.
the sensitivity of reversal signals can be adjusted by changing the number of lines required for a break. traders focused on short-term trading may opt for a two-line break, which generates more frequent signals. for long-term investors, a four-line or ten-line break might be more suitable, as these reduce the number of signals.
stephen nison suggests using three-line break charts in conjunction with candlestick charts. this approach involves identifying the main trend direction using the three-line break chart and then pinpointing specific entry and exit points with candlesticks.
parameters
lb - number of break lines used to determine reversals.
the reversal signals sensitivity can be varied by changing the amount of lines used to register the break. thus, traders who practise short-term operations can use a two-line break, which gives more reversal signals. for investors who are interested in long-term outlook, four-line or even ten-line breaks can be more preferable since they decrease the amount of signals.in japan, the three-line break is the most commonly used.
s. nison recommends to use three-line break charts together with candlesticks. doing so, one is supposed to detect the direction of the main trend using the former method and determine specific points of entrance and quitting the market.
parameters
lb - count of break lines
You may also like: 20pr exp-3 intraday volatility breakout expert advisor - excellent alternative for script users on MetaTrader 4.
Source Code
#property copyright "robotfx"
#property link "https://robotfx.org"
#property indicator_separate_window
#property indicator_buffers 4
extern int   lb = 3;
extern color coloroffon = white;
extern color color1 = blue;
extern color color2 = red;
double lab[];
double hu[];
.......
⚠ Limitations & Risk Warning
- This tool is provided for educational and testing purposes only.
- Past performance does not guarantee future results.
- Trading involves substantial risk of loss. Use on a demo account first.
- Results may vary depending on market conditions, broker, and settings.
- We recommend thorough backtesting and forward testing before using with real funds.