Smart Money Concepts
This is a powerful addition to your MetaTrader 5 toolkit designed to optimize market analysis and performance. This technical indicator acts as a specialized analysis tool designed to visualize market data. It helps traders identify emerging trends, momentum shifts, and key support or resistance levels by plotting statistical calculations directly onto price charts.
How to Setup and Use Smart Money Concepts
1. Installation: Place your file in the MQL/Indicators folder via "Open Data Folder" and restart your terminal.
2. Loading: Find the indicator in the Navigator, drag it onto your chart, and configure the input parameters in the popup window.
3. Customization: Press Ctrl+I to open the indicator list, select your tool, and click "Properties" to change colors, levels, or visual styles.
4. Updating: Replace the old file in the Indicators folder with the new version and restart the platform to apply changes.
Frequently Asked Questions
Q: Why is my indicator not showing? A: Verify the file is in the MQL/Indicators folder, or try right-clicking the "Indicators" tree in the Navigator and clicking "Refresh."
Q: Do custom indicators slow down the platform? A: Too many complex indicators can impact performance; remove unused ones via the "Indicator List" (Ctrl+I).
Q: Can I use MT4 indicators on MT5? A: No, MQL4 and MQL5 are distinct languages; ensure the indicator is compiled specifically for your platform version.
Description & Settings
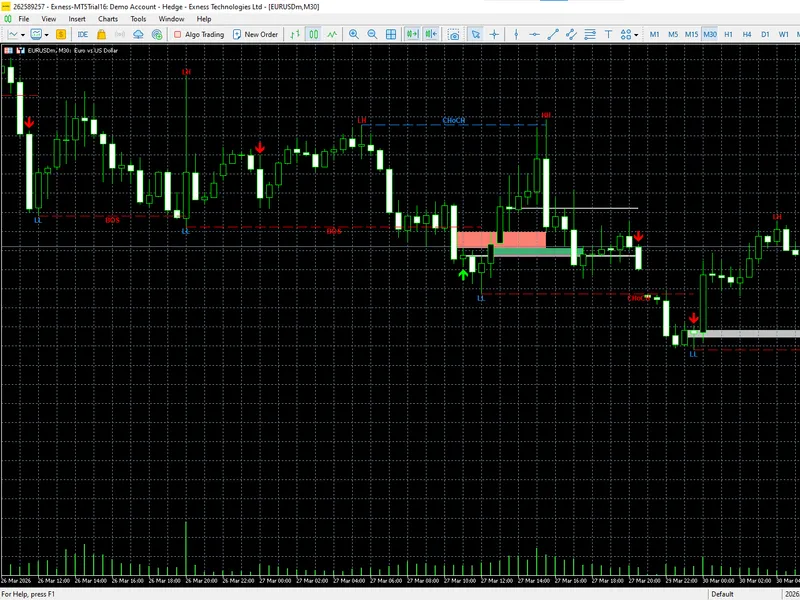
This indicator brings the full Smart Money Concepts (SMC) framework directly onto your MetaTrader 5 chart. It automatically detects and visualizes five core institutional concepts in real time:
Market Structure (BOS/CHoCH)
,
Order Blocks (OB)
,
Fair Value Gaps (FVG)
,
Equal Highs and Equal Lows (EQH/EQL)
, and
BUY/SELL signal arrows
. Each component is independently toggleable, fully color-customizable, and ATR-adaptive, making this a versatile tool for traders who follow institutional price action methodology across any symbol and timeframe.
The
Market Structure
engine identifies swing pivots using a configurable lookback period and draws horizontal lines at each confirmed Break of Structure (BOS) or Change of Character (CHoCH). Swing labels (HH, HL, LH, LL) are plotted directly at pivot points to give you an at-a-glance view of trend development. When a bullish BOS is confirmed, the indicator looks back for the most recent bearish (down-close) candle before the breakout and marks it as a
Bullish Order Block
. The reverse logic applies for bearish BOS events, locating the last bullish candle and registering a
Bearish Order Block
. Order Blocks are drawn as filled rectangles using the midpoint-to-bottom (bull) or top-to-midpoint (bear) of the origin candle body, and they are automatically deactivated (grayed out) when price mitigates them.
Fair Value Gaps
are identified using the classic three-candle imbalance pattern: a bullish FVG forms when the low of the candle two bars ahead is higher than the high of the candle two bars behind, leaving an unfilled gap in the price ladder. A minimum gap size of 15% of ATR filters out noise. FVGs are displayed as semi-transparent boxes and are also deactivated on mitigation. The
Equal Highs and Equal Lows
module scans for pivot highs or lows that match a previous pivot within an ATR-based sensitivity threshold, then draws a dashed line connecting the two levels and labels them EQH or EQL, highlighting liquidity pools that smart money is likely to target.
Key features at a glance:
Automatic BOS and CHoCH detection with trend-state tracking
HH / HL / LH / LL swing labels drawn at each pivot
Bullish and Bearish Order Block zones with mitigation logic
Bullish and Bearish Fair Value Gap boxes with mitigation logic
Equal Highs and Equal Lows detection with dashed connector lines
BUY and SELL arrow signals based on OB retest (with optional FVG confluence filter)
ATR-14 adaptive thresholds for noise-free detection on all timeframes
All five modules are independently toggleable and fully color-customizable
Automatic chart cleanup on removal or reinitialization
Input Parameters
Note:
This indicator is provided for educational and analytical purposes only. Past signal performance does not guarantee future results. Always validate on a demo account before using on live capital.