Symbol Movement
This professional-grade solution for MetaTrader 4 helps traders achieve greater efficiency in their daily workflow. This technical indicator acts as a specialized analysis tool designed to visualize market data. It helps traders identify emerging trends, momentum shifts, and key support or resistance levels by plotting statistical calculations directly onto price charts.
How to Setup and Use Symbol Movement
1. Installation: Place your file in the MQL/Indicators folder via "Open Data Folder" and restart your terminal.
2. Loading: Find the indicator in the Navigator, drag it onto your chart, and configure the input parameters in the popup window.
3. Customization: Press Ctrl+I to open the indicator list, select your tool, and click "Properties" to change colors, levels, or visual styles.
4. Updating: Replace the old file in the Indicators folder with the new version and restart the platform to apply changes.
Frequently Asked Questions
Q: Why is my indicator not showing? A: Verify the file is in the MQL/Indicators folder, or try right-clicking the "Indicators" tree in the Navigator and clicking "Refresh."
Q: Do custom indicators slow down the platform? A: Too many complex indicators can impact performance; remove unused ones via the "Indicator List" (Ctrl+I).
Q: Can I use MT4 indicators on MT5? A: No, MQL4 and MQL5 are distinct languages; ensure the indicator is compiled specifically for your platform version.
Description & Settings
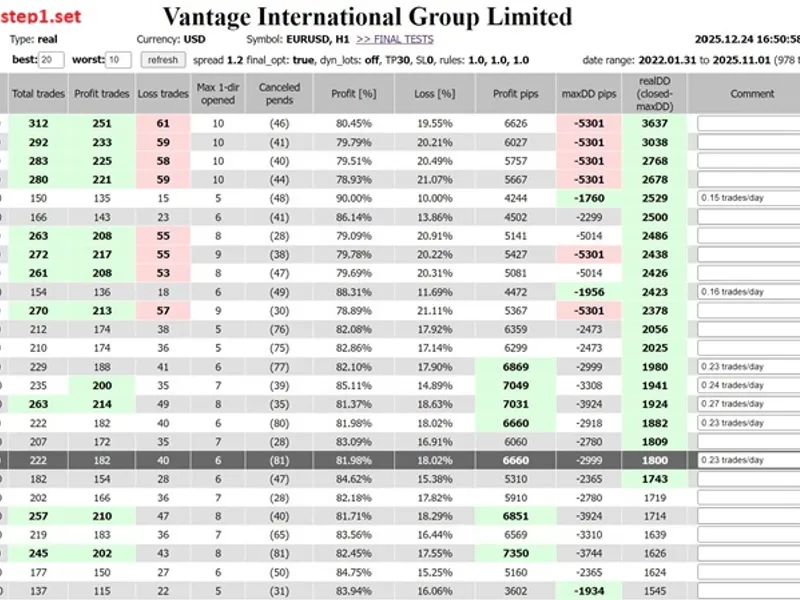
This custom indicator will show you 28 pair's daily candle range, High-Low range, candle bullishness or bearishness from real tick market. So you can understand the overall market situation very short time. You can change the default timeframe from Daily to any period and default candle (bar) number from 0 to any previous number. Also you can open the required symbol by clicking the symbol button.
To understand the indicator's activity, please see the attached image:
Input parameters
Candle Number
- To get real time information, you should use 0 value for running candle. So indicator will show you every point update in panel box. You also can use any higher value than 0 for specific previous candle information.
Timeframe
- Change the timeframe from here. Your chart can be any timeframe, but indicator will show you this period's information in the panel box. Default timeframe is Daily, but you can use any timeframe by changing from here.
Button Bullish Color
- Define your button bullish color from here for the panel box.
Button Bearish Color
- Define your button bearish color from here for the panel box.
Button Text Color
- Define your button text color from here for the panel box.
Show Market Price
- Market price will be bid or ask price. Select from here Bid price or Ask price. If None is selected, no market price will be shown on panel box and panel width size will be decreased automatically.
Button Height
- Define your button height size from here for the panel box.
Button Font Size
- Define your button font size from here for the panel box.