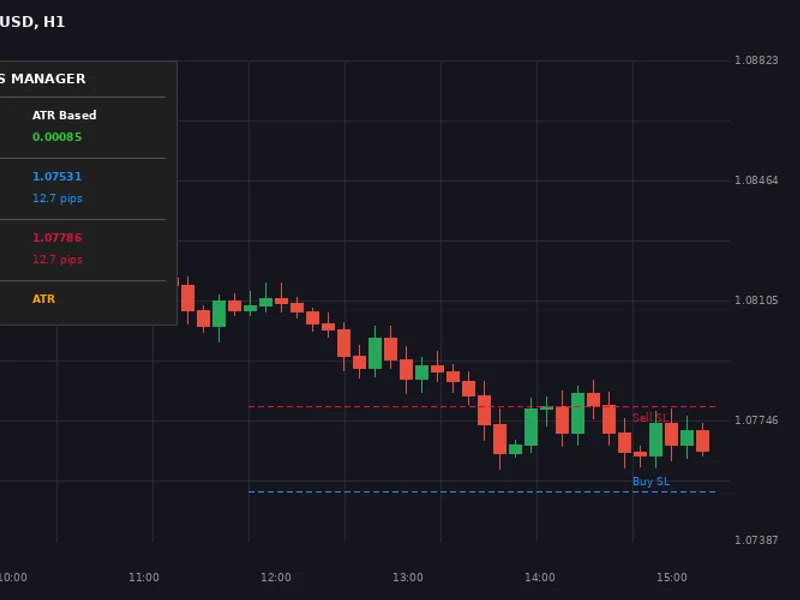
Support and Resistance Indicator
This software component for MetaTrader 4 is built to enhance the capabilities of your trading environment. This technical indicator acts as a specialized analysis tool designed to visualize market data. It helps traders identify emerging trends, momentum shifts, and key support or resistance levels by plotting statistical calculations directly onto price charts.
How to Setup and Use Support and Resistance Indicator
1. Installation: Place your file in the MQL/Indicators folder via "Open Data Folder" and restart your terminal.
2. Loading: Find the indicator in the Navigator, drag it onto your chart, and configure the input parameters in the popup window.
3. Customization: Press Ctrl+I to open the indicator list, select your tool, and click "Properties" to change colors, levels, or visual styles.
4. Updating: Replace the old file in the Indicators folder with the new version and restart the platform to apply changes.
Frequently Asked Questions
Q: Why is my indicator not showing? A: Verify the file is in the MQL/Indicators folder, or try right-clicking the "Indicators" tree in the Navigator and clicking "Refresh."
Q: Do custom indicators slow down the platform? A: Too many complex indicators can impact performance; remove unused ones via the "Indicator List" (Ctrl+I).
Q: Can I use MT4 indicators on MT5? A: No, MQL4 and MQL5 are distinct languages; ensure the indicator is compiled specifically for your platform version.
Description & Settings
The main idea behind it is to search for support and resistance levels,becouse I could not fint any similar indicator. The support and resistance functions do exactly that. When calculating if both support and resistance levels exist, the indicator sdisplays them on the chrt and save their value, so that if the next price is between them, they will remain the same.
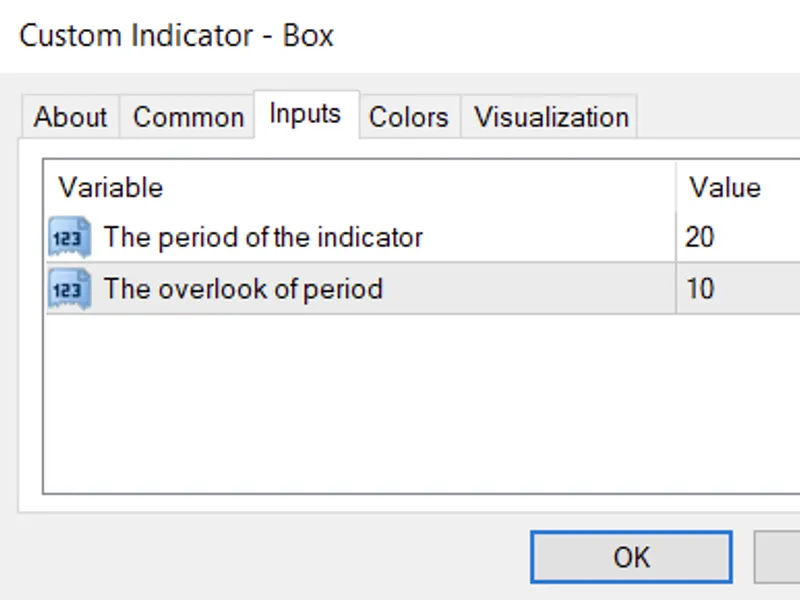
There are 2 input parameters : Period and overlook. The indicator searches for the highest and lowest price for which it is true that it is the highest/lowest in the last (period) bars and also the highest/lowest in the period+overlook bars. If it finds both a highest and a lowest value it displays it on the chart.
The i parameter running in the OnCalculate function should always run from period+overlook.
The indicator does not use any include files. I recommend the settings: period: 20, overlook : 10.