


Seasonal Trading Indicator for MetaTrader
Info
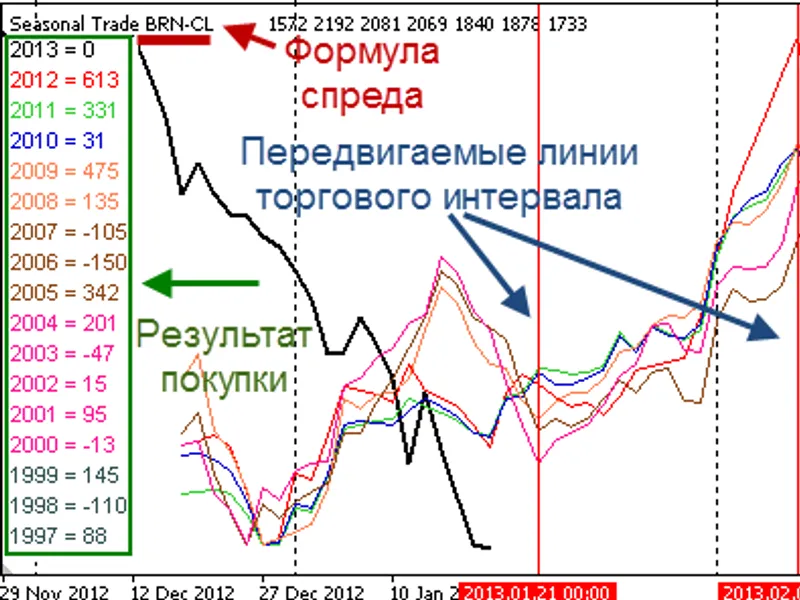
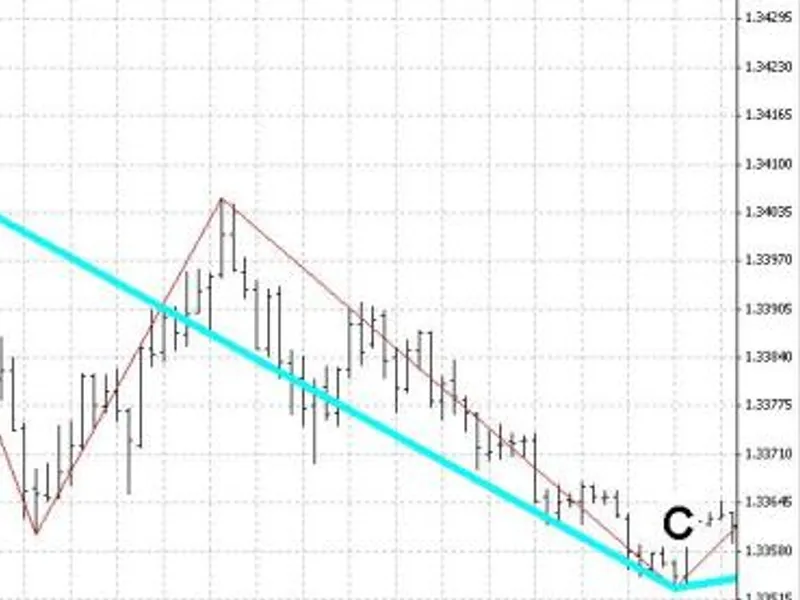
The Seasonal Trading Indicator for MetaTrader is a Indicator for MetaTrader 4 that seasonal trading indicatorthis indicator displays a spread line (virtual equity line) for one or more instruments, overlaying annual trends on the chart. The figure below shows the indicator's result when constructing a spread of buying Brent crude oil against selling Light Sweet crude oil:Fig.
Usage
This tool is typically used for enhancing chart analysis and decision making.
Platform
This Indicator works exclusively on MetaTrader 4 (both build 600+ and newer versions).
Setup
Place the downloaded file in MQL4/Indicators folder via File ? Open Data Folder in MetaTrader 4.
How to Install and Use Seasonal Trading Indicator for MetaTrader
1. Installation: Place your file in the MQL/Indicators folder via "Open Data Folder" and restart your terminal.
2. Loading: Find the indicator in the Navigator, drag it onto your chart, and configure the input parameters in the popup window.
3. Customization: Press Ctrl+I to open the indicator list, select your tool, and click "Properties" to change colors, levels, or visual styles.
4. Updating: Replace the old file in the Indicators folder with the new version and restart the platform to apply changes.
Frequently Asked Questions
Q: Why is my indicator not showing? A: Verify the file is in the MQL/Indicators folder, or try right-clicking the "Indicators" tree in the Navigator and clicking "Refresh."
Q: Do custom indicators slow down the platform? A: Too many complex indicators can impact performance; remove unused ones via the "Indicator List" (Ctrl+I).
Q: Can I use MT4 indicators on MT5? A: No, MQL4 and MQL5 are distinct languages; ensure the indicator is compiled specifically for your platform version.
What this tool does
Seasonal Trading IndicatorThis indicator displays a spread line (virtual equity line) for one or more instruments, overlaying annual trends on the chart.
Typical Use Case
This Indicator excels in automated trading and technical analysis on MetaTrader 4.
Compatible Platform & Setup
This Indicator works on MetaTrader 4. Place the file in the MQL4/Indicators folder and restart the terminal.
Description & Settings
Related: Bars Alligator Trading Advisor - another powerful indicator for MetaTrader 4 traders.
Seasonal Trading IndicatorThis indicator displays a spread line (virtual equity line) for one or more instruments, overlaying annual trends on the chart.
Also recommended: Spread Indicator for Pair Trading - similar indicator with strong performance on MetaTrader 4.
The figure below shows the indicator's result when constructing a spread of buying Brent crude oil against selling Light Sweet crude oil:Fig. 1 Multi-year trends for BUY BRN - SELL CL spread
This indicator is primarily designed for use on the daily timeframe. However, if historical daily timeframe data is insufficient for a deeper analysis, the indicator will use data from higher timeframes, interpolating it to the current timeframe.
Parameters:
Formula
- A string parameter where you should input the spread formula. For example, AA+BB-CC=1^1^2 means that if you buy 1.00 lot of instrument AA and 1.00 lot of BB, and sell 2.00 lots of asset CC, the account equity will change in the same way as the black bold line. If trade volumes are not specified, as in the example in the figure, the indicator will display the result of balanced trades with a volume of 1 lot.
Future
- The number of bars into the future for which multi-year trends will be displayed. This shifts the historical lines.
Past
- The number of trading bars before the current bar.
BaseSymbol
- The index of the base instrument used to calculate profit points. If BaseSymbol = 0, the indicator calculates profit in points of the first instrument.
Compress
- If Compress > 0, this option fits past years into the current spread. Compress is the number of current year spread bars taken as a basis.
This mode is useful for visually determining the best days to enter or exit a trade. However, in crosshair mode, you cannot measure past years' profits.
Visual
- Displays information in the upper left corner of the chart about profits for the specified period for each year individually. The period is set by moving two vertical lines on the current instrument's chart. In Fig. 1, these lines indicate the interval from December 10th to 29th. The chart shows that if you buy the spread during this period, you are likely to make a profit. The yearly breakdown indicates that 3 out of the past 10 years were unprofitable. Each year is colored according to the line it primarily participates in.
To update the calculation after moving the vertical lines, reinitialize the indicator. You can do this by opening the indicator properties window (Ctrl+I) and clicking OK, or by simply changing the timeframe to any other and then back.
The indicator uses all 8 buffers. The zero buffer always displays the current spread, and the other 7 display averaged spreads over several years. The averaging intervals are set in the Interval_ variables using a hyphen. For example, "7-1" means averaging will be done from year 7 to year 1 inclusive. Thus, for the year 2012, the first year of age is 2011, and the seventh is 2005.
To download the necessary quote data for commodity instruments, you can use the following scripts:
CSV Converter Quandl to MT4
- for downloading bundled futures instruments;
CSV Converter Quandl to MT4 (Calendar Version)
- for downloading contracts for specific commodity delivery months.
You may also like: The Little Whore Trading Strategy - excellent alternative for indicator users on MetaTrader 4.
⚠ Limitations & Risk Warning
- This tool is provided for educational and testing purposes only.
- Past performance does not guarantee future results.
- Trading involves substantial risk of loss. Use on a demo account first.
- Results may vary depending on market conditions, broker, and settings.
- We recommend thorough backtesting and forward testing before using with real funds.