Download ALL MT4 indicators (1636)

Similar MetaTrader Tools
MT4 Experts


MT4 Indicators


MT5 Experts


MT5 Indicators


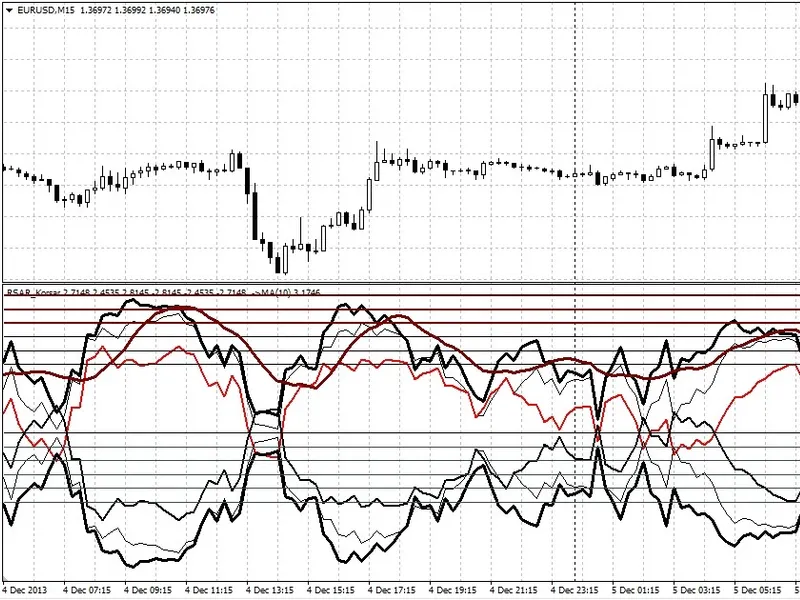
RSAR Korsar Indicator: A Comprehensive Guide
Info
The RSAR Korsar Indicator: A Comprehensive Guide is a Indicator for MetaTrader 4 that mirror-periodic indicator. Based on RSI, Stochastic, RVI, ADX.
Usage
This tool is typically used for enhancing chart analysis and decision making.
Platform
This Indicator works exclusively on MetaTrader 4 (both build 600+ and newer versions).
Setup
Place the downloaded file in MQL4/Indicators folder via File ? Open Data Folder in MetaTrader 4.
How to Install and Use RSAR Korsar Indicator: A Comprehensive Guide
1. Installation: Place your file in the MQL/Indicators folder via "Open Data Folder" and restart your terminal.
2. Loading: Find the indicator in the Navigator, drag it onto your chart, and configure the input parameters in the popup window.
3. Customization: Press Ctrl+I to open the indicator list, select your tool, and click "Properties" to change colors, levels, or visual styles.
4. Updating: Replace the old file in the Indicators folder with the new version and restart the platform to apply changes.
Frequently Asked Questions
Q: Why is my indicator not showing? A: Verify the file is in the MQL/Indicators folder, or try right-clicking the "Indicators" tree in the Navigator and clicking "Refresh."
Q: Do custom indicators slow down the platform? A: Too many complex indicators can impact performance; remove unused ones via the "Indicator List" (Ctrl+I).
Q: Can I use MT4 indicators on MT5? A: No, MQL4 and MQL5 are distinct languages; ensure the indicator is compiled specifically for your platform version.
What this tool does
Mirror-periodic indicator.
Typical Use Case
This Indicator excels in automated trading and technical analysis on MetaTrader 4.
Compatible Platform & Setup
This Indicator works on MetaTrader 4. Place the file in the MQL4/Indicators folder and restart the terminal.
Description & Settings
Related: MA Lock - another powerful indicator for MetaTrader 4 traders.
Mirror-periodic indicator.Based on RSI, Stochastic, RVI, ADX. Operates on extrema and patterns.
Indicator Interface:
The "Korsar" indicator consists of the following technical indicators:
Also recommended: Heiken Ashi Histogram - similar indicator with strong performance on MetaTrader 4.
- RSI
- Stochastic
- ADX
- RVI
Using the abbreviations in order (RSAR) and adding a similar word gives "RSAR_Korsar".
"Korsar" shows the relative strength of the precise direction of movement, displayed by three main lines.
The indicator is considered mirror-periodic.
The formula for the final calculations of the used indicators is as follows:
P * ( N * ((( B + F ) / K ) - (( D + I ) / C ) + (( A + M / L ))))
Explanation of formula variables:
P - the price value.
N - a value of (-1) or (1), which sets the mirror property of the three main lines.
It is (1) if calculating for the three main lines.
It is (-1) if calculating for the three additional lines.
B - a value determined by the Stochastic indicator, serving as a filter for period (1).
The calculation period for the Stochastic indicator is (10, 6, 6) for the three main lines.
F - a value determined by the RVI indicator, serving as an identifier for period (1) and subsequently for synthesizing periods (1), (2), (3) for all periods.
The calculation periods for the RVI indicator are:
(5) for the third line.
(10) for the second line.
(20) for the first line.
K - a value determined by the Stochastic indicator, serving as a filter for the already defined period (1).
The calculation period for the Stochastic indicator is (10, 6, 6) for the three main lines.
It cannot be replaced by the value R, as the functions of the variables are different.
D - a value determined by the ADX indicator, specifically its (+D) line, which generates the positive price direction for creating period (2).
The calculation periods for the ADX indicator are:
(5) for the third line.
(10) for the second line.
(20) for the first line.
I - a value determined by the ADX indicator, specifically its (-D) line, which generates the negative price direction for creating period (2).
The calculation periods for the ADX indicator are:
(5) for the third line.
(10) for the second line.
(20) for the first line.
C - a value determined by the ADX indicator, specifically its (Main) line, which serves as a filter for the price direction generators and creates period (2).
The calculation periods for the ADX indicator are:
(5) for the third line.
(10) for the second line.
(20) for the first line.
A - a value determined by the RSI indicator, serving as a generator for period (3).
The calculation period for the RSI indicator is (5).
M - a value determined by the RSI indicator, serving as a generator for period (3).
The calculation period for the RSI indicator is (20).
L - a value determined by the RSI indicator, serving as a filter for period (3).
The calculation period for the RSI indicator is (15).
For clarity, the formula parts are designated as periods:
Variable 1 - period of price movements.
Variable 2 - period of positive and negative movements.
Variable 3 - Variable 1 - Variable 2.
Variable 4 - period of relative strength movements.
Formula Explanation:
Variable 1 - Variable 2 (Subtracting positive and negative movements from market movements gives the precise direction of price movement).
Variable 4 + Variable 3 (The precise direction of price movement is added to its relative strength. This yields the relative strength of the precise direction of movement).
The mirror display of the lines is achieved through the value of N. This visualization allows for more accurate cycle determination.
----------------------------------------------------------------------------------------------------------------------------------------------------------------------------------------------------------------------------------------------------
Mirror-periodic - a property that explains the indicator's action (one line is displayed twice in the indicator window with inversely proportional values, except for time and direction of movement), (line movement follows a pattern).
The axis of symmetry is set by the user.
The period is set by the user.
Mirror-periodic indicator - an indicator that displays a line twice in the indicator window with inversely proportional values, except for time and direction of movement, which exhibits a pattern in its movement.
Cycle - a series of movements between which a connection and order of reproduction are established.
- Main line (1)
- Main line (2)
- Main line (3)
- Additional line (4)
- Additional line (5)
- Additional line (6)
----------------------------------------------------------------------------------------------------------------------------------------------------------------------------------------------------------------------------------------------------
Entry/Exit Principle.
Two concepts are highlighted: afferent and pattern-based.
Afferent Concept:
Have you noticed how the indicator lines constantly interact with each other?
They intersect, rely on each other.
These phenomena are called afferent and belong to the "Afferent Concept".
There are special entry rules for afferent phenomena.
Afferent phenomena are observed on almost all indicators!
The "Afferent Concept" is used for determining entry/exit with the "RSAR_Korsar" indicator.
Examples of afferent phenomena:
- Intersection
- Support
Pattern Concept:
The "Pattern Concept" is used to determine the relative stability and strength of the precise direction of movement.
The indicator cycles consist of patterns:
- Body
- Membrane
- X or X Zone
- Y or Y Zone
Figures are formed by the movement of the "Korsar" indicator line.
Body - a pattern that indicates a movement of a certain strength; the larger the body, the greater the relative strength of the movement.
Example:
- Small body, indicating low relative strength of the precise direction of movement
- Small body, indicating low relative strength of the precise direction of movement
- Large body, indicating high relative strength of the precise direction of movement
- Large body, indicating high relative strength of the precise direction of movement
- Large body, indicating high relative strength of the precise direction of movement
Membrane - a pattern that appears only within the body pattern and under specific conditions. It signals the presence of a stable movement.
Specific conditions for the appearance of a membrane include a prolonged period of line (1) support at one of the following levels:
- 2.5
- 3
- 3.5
- 4
- 4.5
- 5
Example:
X or X Zone - movement of lines (3) and (4) such that an afferent phenomenon (only intersection) occurs.
Indicates a minor indicator anomaly.
Suppose an "X" appears, followed by another "X", and then a third "X" forms. In such a case (3 or more "X"s in a row), trading with RSAR_Korsar becomes risky. (After a new pattern appears, the influence of "X"s disappears until new clusters of "X"s emerge).
Example:
- Cluster of "X"s.
Y or Y Zone.
The most mysterious and surprising patterns. They indicate a major indicator anomaly.
They occur rarely, so do not be concerned.
Example:
----------------------------------------------------------------------------------------------------------------------------------------------------------------------------------------------------------------------------------------------------
Postulates.
1
If an afferent phenomenon, specifically an intersection between line (1), line (2), and SMA with a period of 10, occurs below level 2.5, a buy order is not executed.
There is an exception, shown below.
- Exception.
- Purchase is prohibited.
2
If an afferent phenomenon, specifically an intersection between line (3) and level (0), has occurred and line (3) has not fallen below level (0.5), then a sell order is not executed.
Entry/Exit Variant #1 (Buy only).
1) If an afferent phenomenon, specifically an intersection between line (1), line (2), and SMA with a period of 10, occurs above level 2.5 but below level 3, a buy order is placed. The order should be closed when line (1) and line (2) are below level 4 but above level 3.5.
2) If an afferent phenomenon, specifically an intersection between line (1), line (2), and SMA with a period of 10, occurs above level 3 but below level 3.5, a buy order is placed. The order should be closed when line (1) and line (2) are below level 4.5 but above level 4.
3) If an afferent phenomenon, specifically an intersection between line (1), line (2), and SMA with a period of 10, occurs above level 3.5 but below level 4, a buy order is placed. The order should be closed when line (1) and line (2) are below level 5 but above level 4.5.
Entry/Exit Variant #2 (Sell only).
If an afferent phenomenon, specifically an intersection between line (3) and level (-0.5), occurs, and line (3) is trending downwards, a sell order is placed. It is closed at the extreme of line (3)'s movement.
The movement may stop at the following levels:
- -0.5
- -1
- -1.5
- -2
- -2.5
Entry/Exit Variant #3 (Buy only).
As soon as the movement of line (3) stops at one of the following levels:
- -0.5
- -1
- -1.5
- -2
- -2.5
a buy order is immediately placed.
Entry/Exit Variant #4 (Buy only).
If an afferent phenomenon, specifically an intersection between line (1), line (2), line (3), and SMA with a period of 10, occurs below level 2.5, a buy order is placed.
----------------------------------------------------------------------------------------------------------------------------------------------------------------------------------------------------------------------------------------------------
Korsar Indicator Settings.
Highlight line 1, line 3, and line 6 in bright colors.
Highlight levels with different colors:
- -0.5
- -1
- -1.5
- -2
- -2.5
Highlight levels with colors:
- 2.5
- 3
- 3.5
such that they cannot be confused with levels:
- 4
- 4.5
- 5
Add SMA with a period of 10 to the indicator.
Highlight it with a color.
It is recommended to use this indicator on the EUR/USD currency pair (M15).
You may also like: AD X Cross Hull Style Indicator - excellent alternative for indicator users on MetaTrader 4.
⚠ Limitations & Risk Warning
- This tool is provided for educational and testing purposes only.
- Past performance does not guarantee future results.
- Trading involves substantial risk of loss. Use on a demo account first.
- Results may vary depending on market conditions, broker, and settings.
- We recommend thorough backtesting and forward testing before using with real funds.