i Fibonacci
This professional-grade solution for MetaTrader 4 helps traders achieve greater efficiency in their daily workflow. This technical indicator acts as a specialized analysis tool designed to visualize market data. It helps traders identify emerging trends, momentum shifts, and key support or resistance levels by plotting statistical calculations directly onto price charts.
How to Setup and Use i Fibonacci
1. Installation: Place your file in the MQL/Indicators folder via "Open Data Folder" and restart your terminal.
2. Loading: Find the indicator in the Navigator, drag it onto your chart, and configure the input parameters in the popup window.
3. Customization: Press Ctrl+I to open the indicator list, select your tool, and click "Properties" to change colors, levels, or visual styles.
4. Updating: Replace the old file in the Indicators folder with the new version and restart the platform to apply changes.
Frequently Asked Questions
Q: Why is my indicator not showing? A: Verify the file is in the MQL/Indicators folder, or try right-clicking the "Indicators" tree in the Navigator and clicking "Refresh."
Q: Do custom indicators slow down the platform? A: Too many complex indicators can impact performance; remove unused ones via the "Indicator List" (Ctrl+I).
Q: Can I use MT4 indicators on MT5? A: No, MQL4 and MQL5 are distinct languages; ensure the indicator is compiled specifically for your platform version.
Description & Settings
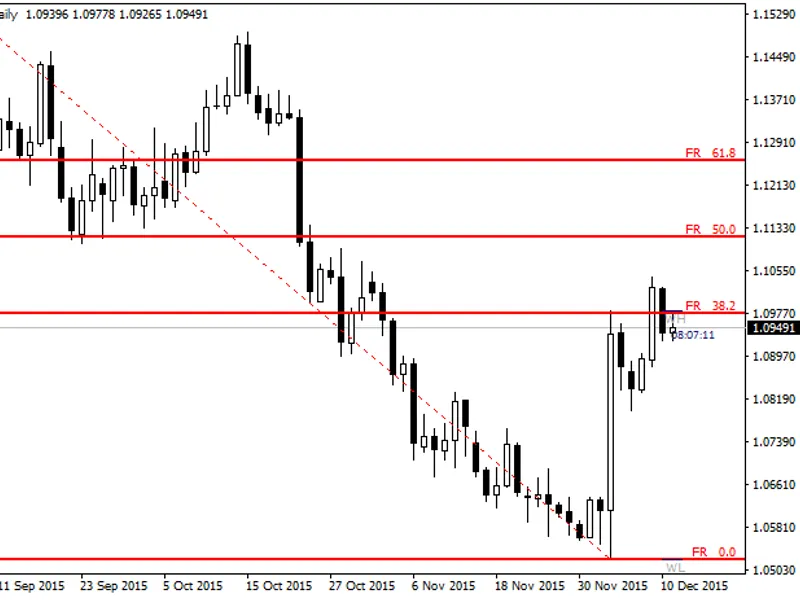
Because I believe in Fibonacci tools, I've decided to add them all in one simple and clean indicator. So here's my first indicator which will draw almost all Fibonacci tools such as Retracement, Arc, Fan, Expansion and Time Zone based on default ZigZag indicator swings.
Update: v1.01 (29/12/2015)
Added Sunday's calculation for High, Low, Pivot Points.
Changed ZigZag Depth value to "24" instead of "21" for more drawing accuracy.
Improved Arc Scale formula.
Improved the performance of the Indicator.
Features:
Control the ZigZag values: Depth, Deviation, Backstep.
You can change the colors, width and style on all tools.
Ability to draw the tools on fixed Time Frame.
Show/Hide whatever tool you like.
Show/Hide extra levels: 14.6, 23.6, 76.4, 88.6, 127.2.
Show Daily, Weekly, Monthly High/Low with Standard pivot.
Draw triangles on the latest 6 ZigZag points.
Show Candle time left.
Credit:
JimDandy
WHRoeder
RaptorUK
deVries