Download ALL MT4 indicators (1640)

Similar MetaTrader Tools










RJ HSlice 1.1 Indicator
Info
The RJ HSlice 1.1 Indicator is a Indicator for MetaTrader 4 that the rj hslice 1. 1 indicator displays buy and sell ranges on a chart.
Usage
This tool is typically used for enhancing chart analysis and decision making.
Platform
This Indicator works exclusively on MetaTrader 4 (both build 600+ and newer versions).
Setup
Place the downloaded file in MQL4/Indicators folder via File ? Open Data Folder in MetaTrader 4.
How to Install and Use RJ HSlice 1.1 Indicator
1. Installation: Place your file in the MQL/Indicators folder via "Open Data Folder" and restart your terminal.
2. Loading: Find the indicator in the Navigator, drag it onto your chart, and configure the input parameters in the popup window.
3. Customization: Press Ctrl+I to open the indicator list, select your tool, and click "Properties" to change colors, levels, or visual styles.
4. Updating: Replace the old file in the Indicators folder with the new version and restart the platform to apply changes.
Frequently Asked Questions
Q: Why is my indicator not showing? A: Verify the file is in the MQL/Indicators folder, or try right-clicking the "Indicators" tree in the Navigator and clicking "Refresh."
Q: Do custom indicators slow down the platform? A: Too many complex indicators can impact performance; remove unused ones via the "Indicator List" (Ctrl+I).
Q: Can I use MT4 indicators on MT5? A: No, MQL4 and MQL5 are distinct languages; ensure the indicator is compiled specifically for your platform version.
What this tool does
The RJ HSlice 1.
Typical Use Case
This Indicator excels in automated trading and technical analysis on MetaTrader 4.
Compatible Platform & Setup
This Indicator works on MetaTrader 4. Place the file in the MQL4/Indicators folder and restart the terminal.
Description & Settings
Related: External Range Liquidity (ERL) Indicator: Advanced Market Structure and Liquidity Analysis - another powerful indicator for MetaTrader 4 traders.
The RJ HSlice 1.1 indicator displays buy and sell ranges on a chart.Also recommended: B Bands Psar Indicator - similar indicator with strong performance on MetaTrader 4.
Indicator Description
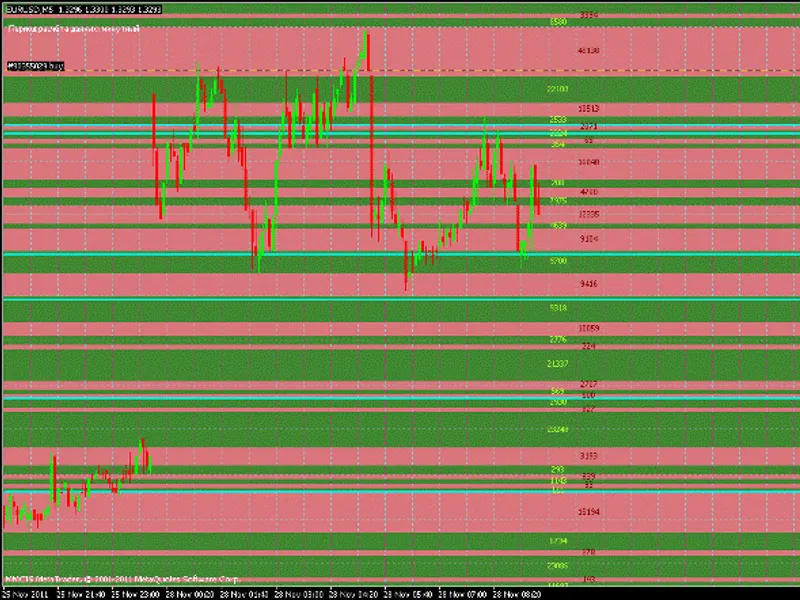
The green zone on the chart indicates price levels where there are more buys over a certain period, represented by a numerical value showing the difference in contracts. The red zone represents sells, which can be used to identify areas between call/put and support/resistance levels.
The indicator calculates the RJ Volume over a minute period and transmits this data to the RJ HSlice 1.1 indicator. It is recommended to use this indicator in conjunction with other indicators for more accurate results.
Installation Instructions
To install the indicator, place two files in the terminal's Experts and Indicators folders, then compile the editor and attach the RJ HSlice 1.1 indicator to the chart. Note that the RJ Volume indicator should not be attached to the chart, as it can cause issues with 5-digit terminals.
Indicator Settings
The CalcPeriod setting is used to specify the time period in minutes, with a default value of 1. If a different time frame is required, the value can be adjusted accordingly. For example, to render the data in a specific time frame, the value should be set to 60. The indicator also includes protection against configuration errors, ensuring that it will still function even if an incorrect value is entered.
The ShowLevelsOn setting is used to display all price levels, with a default value of true. Setting this to false will remove all levels from the chart. The ShowContractOn setting is used to display the contract values, with a default value of true. Setting this to false will remove all contract values from the chart. The BackgroundLevelOn setting is used to render the background levels when ShowLevelsOn is enabled. The ShowTurningOn setting is used to set the support line of resistance, which is useful for identifying areas where the price is likely to turn.
Additional Settings
The PercentDiscrep setting is used to specify the rate difference between levels, with a default value of 0.2 (20%). This setting can be adjusted to change the sensitivity of the indicator. The ColorLine setting is used to specify the color of the lines, with a default value of aqua.
Understanding the Indicator
The RJ HSlice 1.1 indicator is based on the idea that if the candle open is less than the close, then the buy value is calculated as the difference between the high and low, plus the difference between the close and open. The sell value is calculated as the difference between the high and low. The distribution value is then calculated as the volume divided by the sum of the buy and sell values. This value is used to determine the call and put values, which are then used to render the chart.
Testing the Indicator
To test the indicator, it is recommended to upload or save it as a template, then experiment with different settings and time frames to see how it performs. It is also recommended to ask questions and seek answers to any issues that may arise during testing.
You may also like: Fast Stochastic Indicator - excellent alternative for indicator users on MetaTrader 4.
Source Code
#property copyright "robotfx"
#property link "https://robotfx.org"
#property indicator_chart_window
extern int    depthcalcday      = 30;
extern double updatetime        = 1;
extern int    calcperiod        = 1;
extern double percentdiscrep    = 0.2;
extern bool   showlevelson      = true;
extern bool   showturningon     = true;
extern bool   showcontracton    = true;
.......
⚠ Limitations & Risk Warning
- This tool is provided for educational and testing purposes only.
- Past performance does not guarantee future results.
- Trading involves substantial risk of loss. Use on a demo account first.
- Results may vary depending on market conditions, broker, and settings.
- We recommend thorough backtesting and forward testing before using with real funds.