i Pulsar - indicator of critical price levels
This software component for MetaTrader 4 is built to enhance the capabilities of your trading environment. This technical indicator acts as a specialized analysis tool designed to visualize market data. It helps traders identify emerging trends, momentum shifts, and key support or resistance levels by plotting statistical calculations directly onto price charts.
How to Setup and Use i Pulsar - indicator of critical price levels
1. Installation: Place your file in the MQL/Indicators folder via "Open Data Folder" and restart your terminal.
2. Loading: Find the indicator in the Navigator, drag it onto your chart, and configure the input parameters in the popup window.
3. Customization: Press Ctrl+I to open the indicator list, select your tool, and click "Properties" to change colors, levels, or visual styles.
4. Updating: Replace the old file in the Indicators folder with the new version and restart the platform to apply changes.
Frequently Asked Questions
Q: Why is my indicator not showing? A: Verify the file is in the MQL/Indicators folder, or try right-clicking the "Indicators" tree in the Navigator and clicking "Refresh."
Q: Do custom indicators slow down the platform? A: Too many complex indicators can impact performance; remove unused ones via the "Indicator List" (Ctrl+I).
Q: Can I use MT4 indicators on MT5? A: No, MQL4 and MQL5 are distinct languages; ensure the indicator is compiled specifically for your platform version.
Description & Settings
The indicator registers the price level breakout moments and the significance of these levels. The significance of a level is determined by how long it had not been broken through in the past. The level breakout may be interpreted as a possible start of the price movement reversal.
There is a noise filter and a signal significance filter, which allow to exclude reactions to insignificant levels, as well as the signals with no substantially new information.
Developed in 2012, published on the MQL4 forum. Improved on 2015 on the request of Lesorub — added alerts for parallel tracking of several price charts by the trader.
External variables:
Scale
— the timescale of "looking into the past" (in minutes). I generally use 1440, i.e. I measure the significance of the level in 24 hours.
ScaleDigits
— the number of digits after the decimal point on the "looking into the past" timescale (y-axis). Does not affect anything but the digitizing of the y-axis.
LevelFilter
— the minimum significance (depth of operation) of the displayed levels. Measured in
Scale
periods, i.e. in my case — in natural days.
SignalFilter
— the signal significance filter; specified either in bars (if >=0), or in
Scale
periods (if <0). It allows to exclude the display of the signals which contain no substantially new information relative to the one already displayed. The zero value simply disables the repeated display of the already present levels.
SetSignalFilter
— command for activation of the
SignalFilter
. If false, then the signals are not filtered by significance.
Usage example:
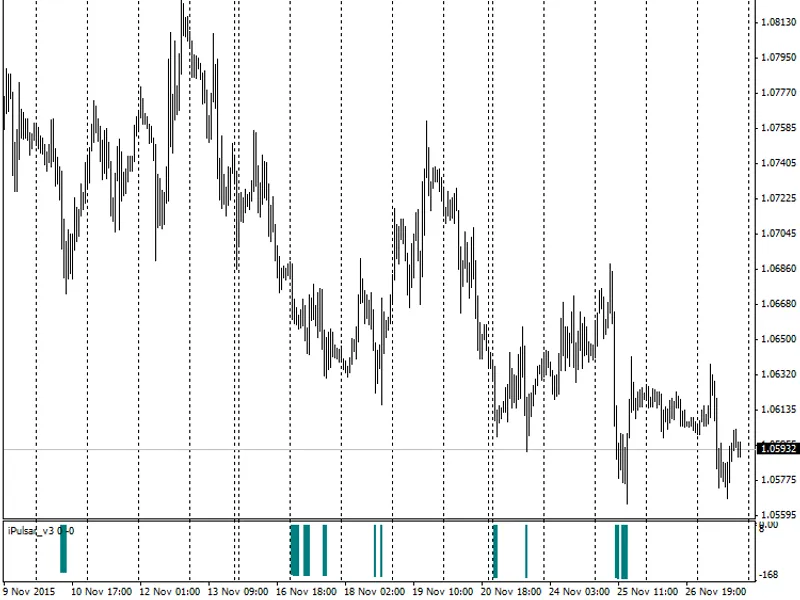
Launching the indicator on November 27, 2015, with the significance filter disabled and with the levels of significance below 5 trade days (a trading week) omitted, gives:
This shows that numerous signals point at the levels of approximately the same significance (140-160 trade days), which were recognized by the indicator in a short history interval (12 trade days). In other words, this may as well be one and the same support level. Determine this level using the signal significance filter. Enabling this filter and setting its value to three trade days gives:
Thus, it was determined that the significance of the current (latest as of November 27) support level on the EURUSD pair equals 151 trade days, and the value of this level is around 1.06592 (shown by a blue horizontal line).
Let's see what was happening in the market 151 trade days prior to the appearance of the signal and in the preceding days (5-10 trade days). To do that, switch to the D1 timeframe and leave the level on the chart, the indicator is no longer needed:
It can be seen that the most significant signal indeed points to the possible reversal level. See which of the trading reference points should be taken into account in the vicinity of this level. In order to do that, it is necessary to lower the requirements to the significance of the signal, up to the value of 16 trade hours, for instance. Here is the result:
Please note that the value of the indicator is formed in real-time and is "redrawn" (merely correcting the value, but not canceling the signal) only on the zero bar, i.e. it is quite possible to use the determined levels for trading. The only problem is determining the correct values of the filtration parameters.