FX5 Divergence
This tool for MetaTrader 4 is specifically engineered to streamline your trading operations. This technical indicator acts as a specialized analysis tool designed to visualize market data. It helps traders identify emerging trends, momentum shifts, and key support or resistance levels by plotting statistical calculations directly onto price charts.
How to Setup and Use FX5 Divergence
1. Installation: Place your file in the MQL/Indicators folder via "Open Data Folder" and restart your terminal.
2. Loading: Find the indicator in the Navigator, drag it onto your chart, and configure the input parameters in the popup window.
3. Customization: Press Ctrl+I to open the indicator list, select your tool, and click "Properties" to change colors, levels, or visual styles.
4. Updating: Replace the old file in the Indicators folder with the new version and restart the platform to apply changes.
Frequently Asked Questions
Q: Why is my indicator not showing? A: Verify the file is in the MQL/Indicators folder, or try right-clicking the "Indicators" tree in the Navigator and clicking "Refresh."
Q: Do custom indicators slow down the platform? A: Too many complex indicators can impact performance; remove unused ones via the "Indicator List" (Ctrl+I).
Q: Can I use MT4 indicators on MT5? A: No, MQL4 and MQL5 are distinct languages; ensure the indicator is compiled specifically for your platform version.
Description & Settings
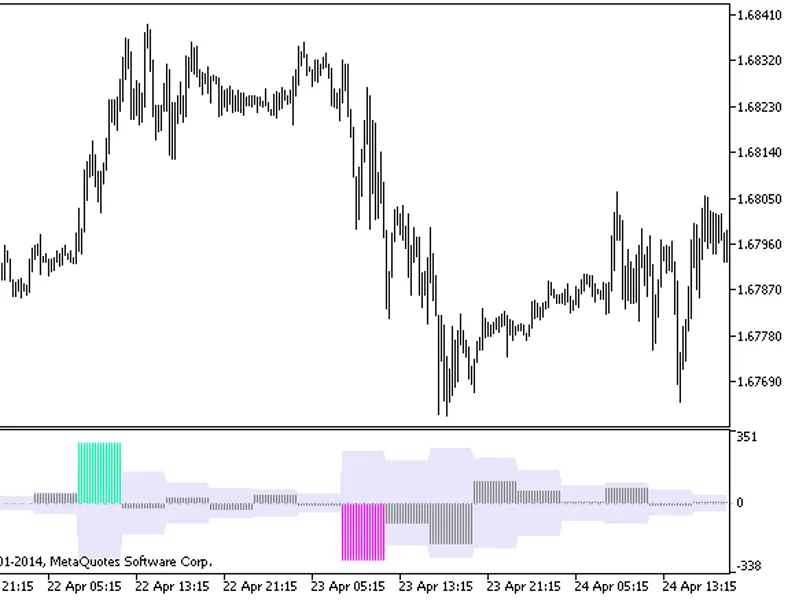
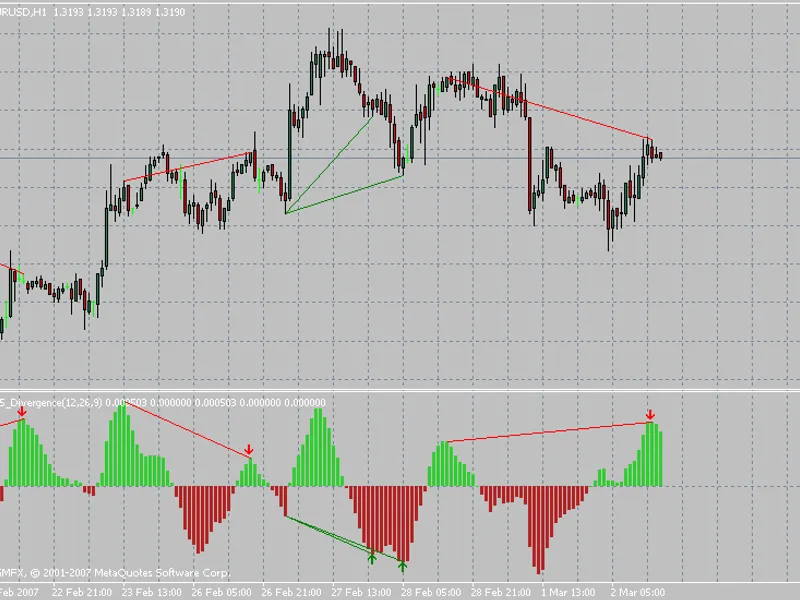
Divergence is a powerful tool for detecting price reversal points from support and resistance zones. It usually gives us a relatively early signals compared to those given by moving average indicators. It can be successfully applied to many technical indicators and end up with good results.
This indicator will plot divergence lines between the price and OsMA indicator. It will give buy/sell signal according to the type of divergence that was detected. The indicator also is capable of drawing divergence lines for the whole history prices located within a specific chart.
Bullish divergence will be plotted with green lines on both price and OsMA idicator windows.
Bearish divergence will be plotted with red lines on both price and OsMA idicator windows.
I hope this indicator prove to be a useful tool.
A bug was fixed in updating divergence lines as the live quotes flow;
A sound Alert feature was added to the indicator and can be enabled or disabled from indicator settings;
Classical divergence is plotted in Solid Style (continues) lines, while hidden divergence is plotted in Dot Style (interuppted) lines.
The code was rebuilt from scratch to make the indicator runs much faster.
The indicator now doesn't repaint any of its signals.
Some improvements in the signal identification algorithms.