Detection of the divergences
This professional-grade solution for MetaTrader 4 helps traders achieve greater efficiency in their daily workflow. This technical indicator acts as a specialized analysis tool designed to visualize market data. It helps traders identify emerging trends, momentum shifts, and key support or resistance levels by plotting statistical calculations directly onto price charts.
How to Setup and Use Detection of the divergences
1. Installation: Place your file in the MQL/Indicators folder via "Open Data Folder" and restart your terminal.
2. Loading: Find the indicator in the Navigator, drag it onto your chart, and configure the input parameters in the popup window.
3. Customization: Press Ctrl+I to open the indicator list, select your tool, and click "Properties" to change colors, levels, or visual styles.
4. Updating: Replace the old file in the Indicators folder with the new version and restart the platform to apply changes.
Frequently Asked Questions
Q: Why is my indicator not showing? A: Verify the file is in the MQL/Indicators folder, or try right-clicking the "Indicators" tree in the Navigator and clicking "Refresh."
Q: Do custom indicators slow down the platform? A: Too many complex indicators can impact performance; remove unused ones via the "Indicator List" (Ctrl+I).
Q: Can I use MT4 indicators on MT5? A: No, MQL4 and MQL5 are distinct languages; ensure the indicator is compiled specifically for your platform version.
Description & Settings
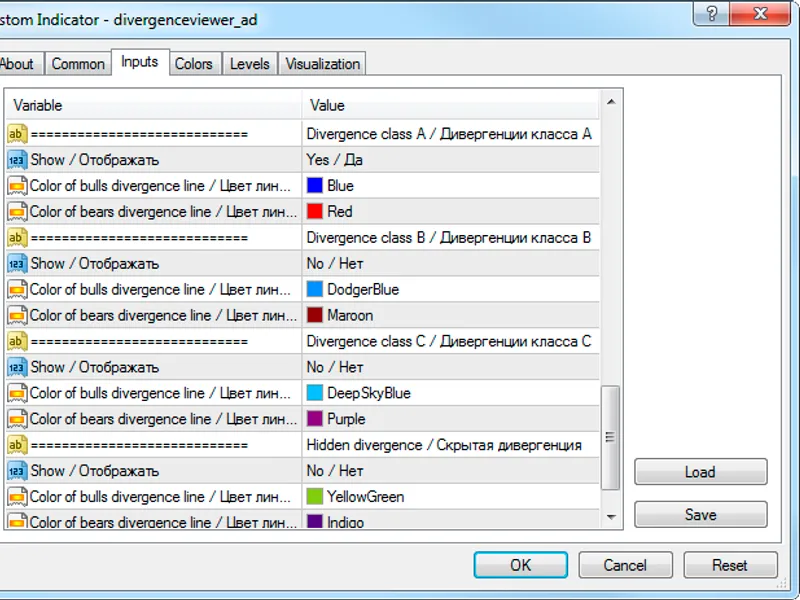
The indicator displays divergences in the form of two matched lines: one on the price chart, the other — on the indicator chart. It allows to register four of divergences. For each of the divergence class there is a switch to indicate the necessity of its registration, as well as the color selection of the bull and the bear divergence lines:
One of the six standard indicators included in the DivergenceViewer (RSI, MACD, Momentum, RVI, Stochastic, Standard Deviation) is used as an indicator that serves as data source for the lookup of the divergences with the price (in the indicator's terminology — the
base indicator
). The indicator can also operate with two non-standard indicators: Derivative and William Blau.
The parameters of the base indicator are set in the input parameter block with the same name:
The parameters should be set in the same order as they are presented in the standard indicator. For example, for the Stochastic base indicator the accordance will be as follows:
"The first calculation period" — %K,
"The second calculation period" — %D,
"The third calculation period" — slowing.
If the number of the base indicator parameters is less than three, then the corresponding calculation periods are simply not displayed, and the values of these parameters are ignored. So, for the RSI and the Momentum indicators it is sufficient to set the values of only two parameters: "The first calculation period" and "Indicator calculation price".
If some other indicator needs to used as the base indicator, then choose the value "Custom" in the "Base indicator" parameter, and fill the following lines in the "Custom indicator" block:
"Indicator name" — the name of an indicator, which is present in the "Navigator" window of the terminal. Specified without the extension.
"Index of the buffer for data pickup" — the index of the indicator line, values of which will be used for plotting the base indicator chart (most often — 0).
"Number of the indicator parameters" — specify the amount of the input parameters used by the indicator. If set to 0, then the default parameter values will be used for the base indicator.
"Value of the N-th parameter" — set the values of the corresponding parameters of the base indicator.
After setting up the base indicator it is necessary to determine the maximum length of the divergence by filling the "Depth of the 2-nd support point lookup" parameter, and to define how much the price extremums must match the indicator extremums — the "From price extremum to indicator extremum" parameter.
The divergence registration is based on the local extremum lookup. To form any extremum at least three bars are needed, the central of which is the extremum. For that reason, the registration of the divergences is made with a two bar delay. The figure shows the class A divergences and bars marked with vertical lines (not part of the indicator), which show the divergence registration places.
The full description of the indicator capabilities and its formation logic is available in the "" article.