






KCI Standard: A Pure Kinematic Computing Engine for Market Singularity Detection
Info
The KCI Standard: A Pure Kinematic Computing Engine for Market Singularity Detection is a Indicator for MetaTrader 5 that abstractthe kinetic compression index (kci) standard is a high-performance, purely mathematical oscillator designed to detect extreme market exhaustion and volumetric compression points known as "singularities. " By abandoning traditional, lagging indicator handles in favor of native kinematic calculations, KCI offers unparalleled execution speed and CPU efficiency.
Usage
This tool is typically used for enhancing chart analysis and decision making.
Platform
This Indicator works exclusively on MetaTrader 5 (both build 600+ and newer versions).
Setup
Place the downloaded file in MQL5/Indicators folder via File ? Open Data Folder in MetaTrader 5.
How to Install and Use KCI Standard: A Pure Kinematic Computing Engine for Market Singularity Detection
1. Installation: Place your file in the MQL/Indicators folder via "Open Data Folder" and restart your terminal.
2. Loading: Find the indicator in the Navigator, drag it onto your chart, and configure the input parameters in the popup window.
3. Customization: Press Ctrl+I to open the indicator list, select your tool, and click "Properties" to change colors, levels, or visual styles.
4. Updating: Replace the old file in the Indicators folder with the new version and restart the platform to apply changes.
Frequently Asked Questions
Q: Why is my indicator not showing? A: Verify the file is in the MQL/Indicators folder, or try right-clicking the "Indicators" tree in the Navigator and clicking "Refresh."
Q: Do custom indicators slow down the platform? A: Too many complex indicators can impact performance; remove unused ones via the "Indicator List" (Ctrl+I).
Q: Can I use MT4 indicators on MT5? A: No, MQL4 and MQL5 are distinct languages; ensure the indicator is compiled specifically for your platform version.
What this tool does
AbstractThe Kinetic Compression Index (KCI) Standard is a high-performance, purely mathematical oscillator designed to detect extreme market exhaustion and volumetric compression points known as "Singularities.
Typical Use Case
This Indicator excels in automated trading and technical analysis on MetaTrader 5.
Compatible Platform & Setup
This Indicator works on MetaTrader 5. Place the file in the MQL5/Indicators folder and restart the terminal.
Description & Settings
Related: at r - another powerful indicator for MetaTrader 5 traders.
AbstractThe Kinetic Compression Index (KCI) Standard is a high-performance, purely mathematical oscillator designed to detect extreme market exhaustion and volumetric compression points known as "Singularities." By abandoning traditional, lagging indicator handles in favor of native kinematic calculations, KCI offers unparalleled execution speed and CPU efficiency. This article details the mathematical foundation, system architecture, core code mechanics, and practical integration guides for developers looking to implement this asynchronous-proof engine into Expert Advisors and Custom Indicators.
Also recommended: high low lines - similar indicator with strong performance on MetaTrader 5.
Introduction
In the realm of algorithmic trading, precision and computational efficiency are paramount. Most conventional indicators suffer from inherent lag due to their reliance on smoothed averages. When incorporated into Expert Advisors—especially multi-currency or grid-based systems running on virtual private servers (VPS)—calling multiple standard indicator handles can cause memory bloat, execution delays, and critical missed entries.
Problem Statement
Traders and developers constantly face three critical bottlenecks:
- Indicator Lag: Traditional oscillators react too slowly to sudden volumetric spikes and price deviations.
- CPU Overhead: Repeatedly calling external handles via iCustom or native MQL5 functions strains server resources.
- Thread Desynchronization: EAs running asynchronously often miss live market entries because traditional custom indicators take too many milliseconds to calculate on new, fast-moving ticks.
Objectives
The KCI Standard was engineered from the ground up to solve these specific architectural flaws. The primary goals are to:
- Completely eliminate the use of external indicator handles (zero MA dependency).
- Calculate market kinematics directly from raw price and tick volume.
- Provide a polarized, visually intuitive oscillator ranging from -100 to +100.
- Expose clean, zero-lag signal buffers specifically built to survive asynchronous tick threading for EA integration.
Theory / Concepts
KCI is built upon four fundamental pillars of market kinematics, bypassing traditional technical analysis constructs:
- Velocity Quotient (VQ): The kinetic efficiency of the price trajectory.
- Kinetic Displacement (KD): The absolute center of mass deviation, providing pure convergence readings.
- Energy Dispersion (ED): Pure standard deviation utilized as a proxy for spatial market volatility.
- Phase Velocity (PV): Unfiltered linear momentum measuring immediate market thrust.
- Singularity: A mathematical anomaly where directional velocity collapses while volume pressure drops, signaling an imminent absolute reversal.
System Architecture
The KCI engine processes raw market data through a streamlined, multi-phase pipeline managed entirely within a single file:
- Data Ingestion (Raw Price & Volume Data)
- Phase 1: Pure Kinematics (VQ, KD, ED, PV)
- Phase 2: Z-Score Normalization & Exponential Polarization
- Phase 3: Cognitive Validation (Singularity Detection)
- Final Output: Polarized Visuals & EA Signal Buffers
Project Structure
The indicator is compiled as a single KCI.mq5 file, ensuring maximum portability. It utilizes a highly optimized internal buffer structure managed entirely by the MetaTrader 5 terminal (INDICATOR_CALCULATIONS), preventing memory leaks and array-out-of-bounds errors during prolonged operation.
Input Parameters
- ZScore Period: The rolling window used to normalize the kinematic matrices. Default: 50
- Compression Threshold: The mathematical threshold for detecting extreme exhaustion (Singularity). Default: 2.0
- Base Period: The lookback period for raw kinematic calculations. Default: 14
Enumerations & Data Structures
KCI avoids complex external objects to maintain its ultra-lightweight footprint. Its architecture relies on a strict, unalterable array mapping framework.
Exposed Buffers (For EA/Visuals):
- Buffer 0: Main Polarized Line (Visual Data)
- Buffer 1: Line Color Index (Dynamic color mapping)
- Buffer 2: Bullish Singularity Signal (Value 1.0 = Buy)
- Buffer 3: Bearish Singularity Signal (Value 1.0 = Sell)
Internal Buffers (Engine Core):
- Buffer 4-8: Internal Kinematic Matrices (VQ, KD, ED, PV, Raw_KCI)
Algorithm Workflow
- Dynamic Warm-Up: The system calculates available history to prevent crashing on newly listed assets.
- Kinematic Calculation: Computes the baseline physics of the market.
- Z-Score Normalization: Standardizes the vectors to compare them evenly.
- Matrix Summation: Sums the absolute differences to locate extreme matrix compression.
- Polarization: Applies exponential decay to project the raw sum onto a visually intuitive +/- 100 scale.
- Signal Generation: Validates local minimums (V-shapes) coupled with energy exhaustion drops.
Calculation Logic
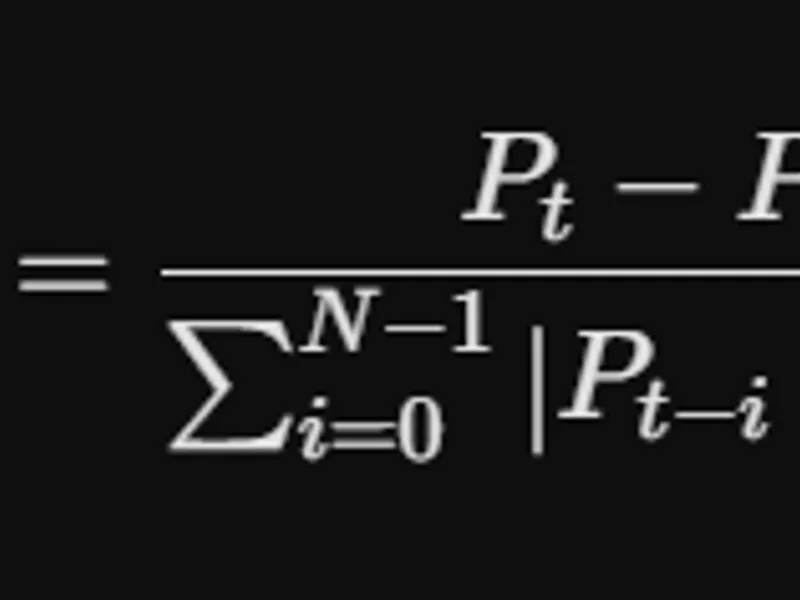
The engine replaces traditional indicators with native mathematical equivalents.
Implementation Details & Code Walkthrough
The Dynamic Z-Score Matrix
Unlike standard indicators that fail if historical bars are missing, KCI dynamically adjusts its Z-Score window. It can begin plotting with as few as 17 bars, making it flawless for newly IPO'd stocks or fresh cryptocurrencies.
How to Use & EA Integration
For Manual Traders: Wait for the KCI line to pierce the Premium (+80) or Discount (-80) levels. Do not trade immediately upon touch. Wait for the indicator to form a sharp "V" or inverted "V" peak; this validates the Singularity and the kinetic exhaustion.
For EA Developers: When calling KCI via iCustom, ensure your EA's OnTick handler accounts for asynchronous thread loading.
Visualization & User Interface
The KCI Standard utilizes a clean, polarized visual interface categorized by institutional trading concepts (Smart Money Concepts):
- Upper Zone (+80): "Premium" – Kinetic energy is heavily overextended to the upside.
- Center Line (0): "Equilibrium" – The market is traversing its natural kinetic center.
- Lower Zone (-80): "Discount" – Extreme downward overextension.
Performance Optimization
- Zero Repainting: The cognitive engine only validates a Singularity on definitively closed candles (i+1 and i+2).
- Automated Memory: Array sizing is delegated entirely to the MT5 terminal via INDICATOR_CALCULATIONS.
- Execution Profile: CPU usage drops to near-zero as KCI calculates only the active bar after the initial historical load.
Advantages & Limitations
Advantages:
- Ultra-Fast: Zero external moving average handles.
- Adaptive Volatility: Exposes mathematical spatial dispersion (ED Buffer) to EAs for dynamic SL/TP calculation, acting as a vastly superior alternative to ATR.
- Asynchronous-Safe: Guaranteed to deliver signals to EAs during violent tick movements.
Limitations:
- Requires a minimum of BasePeriod + 3 bars of history to generate the very first visual plot.
- As an extreme mean-reversion tool, it operates best when paired with a macro-trend filter (like EMA crossovers or Bollinger Bands).
Future Development
The roadmap for KCI involves integrating an auto-optimizing Neural Filter. This future update will allow the algorithm to dynamically adjust its CompressionThreshold based on the specific historical tick volume anomalies of individual assets using localized machine learning.
Conclusion
The Kinetic Compression Index represents a paradigm shift in technical indicator design. By analyzing the relationships between multiple kinematic metrics rather than a single dimension of price action, KCI provides a more holistic view of market structure.
The Polarized Oscillator visualization (-100 to +100 with OB/OS at ±80) makes it accessible to traders familiar with RSI or Stochastic, while the underlying mathematics provide a robust, adaptive framework that conventional oscillators lack.
The Cognitive Validation Engine – combining local minima detection, extreme condition checking, and energy analysis – effectively filters out false signals, making KCI suitable for both manual trading and automated Expert Advisors.
The Energy Dispersion (ED) buffer adds unique value by providing a dynamic volatility measure that can be directly used for position sizing, stop-loss placement, and take-profit targeting – bridging the gap between signal generation and risk management.
KCI is not just an indicator; it is a universal core that can serve as the foundation for a wide range of trading systems, from simple entry signals to complex multi-symbol dashboards.
Frequently Asked Questions (FAQ)
Q: Why does KCI show EMPTY_VALUE on some bars?
A: KCI requires at least BasePeriod + 3 bars to begin calculation. Bars before this threshold display EMPTY_VALUE.
Q: Are the signals repainting?
A: No. Signals are written to Bullish_Buffer[i+1] and Bearish_Buffer[i+1] only after the bar at index i+1 is confirmed. Once written, they never change.
Q: What timeframe works best with KCI?
A: KCI works on all timeframes. Shorter timeframes (M1-M15) produce more signals but with lower reliability. Higher timeframes (H1-D1) produce fewer but more reliable signals.
Q: How do I interpret the ED value for SL/TP?
A: ED represents the standard deviation of prices over the BasePeriod. A common approach is SL = ED × 1.5 and TP = ED × 3.0. Adjust multipliers based on your risk tolerance.
Q: Can I use KCI with other indicators?
A: Yes. KCI can be combined with trend filters (e.g., MA, ADX) or momentum confirmations (e.g., iRSI, iMACD) to create more sophisticated strategies.
You may also like: rs i - of adaptive t3 - excellent alternative for indicator users on MetaTrader 5.
Source Code
#property copyright "RobotFX"
#property link "https://robotfx.org"
#property description "This code is educational. Feel free to use, modify and upgrade as you wish. Visit ROBOTFX.ORG for professional trading tools"
#property indicator_separate_window
#property indicator_buffers 9
#property indicator_plots   1
#property indicator_label1  "KCI (Polarized)"
#property indicator_type1   DRAW_COLOR_LINE
#property indicator_color1  clrDodgerBlue,clrRed
#property indicator_style1  STYLE_SOLID
.......
⚠ Limitations & Risk Warning
- This tool is provided for educational and testing purposes only.
- Past performance does not guarantee future results.
- Trading involves substantial risk of loss. Use on a demo account first.
- Results may vary depending on market conditions, broker, and settings.
- We recommend thorough backtesting and forward testing before using with real funds.