Consecutive Candles with Stochastic Filter Indicator
This is a powerful addition to your MetaTrader 4 toolkit designed to optimize market analysis and performance. This technical indicator acts as a specialized analysis tool designed to visualize market data. It helps traders identify emerging trends, momentum shifts, and key support or resistance levels by plotting statistical calculations directly onto price charts.
How to Setup and Use Consecutive Candles with Stochastic Filter Indicator
1. Installation: Place your file in the MQL/Indicators folder via "Open Data Folder" and restart your terminal.
2. Loading: Find the indicator in the Navigator, drag it onto your chart, and configure the input parameters in the popup window.
3. Customization: Press Ctrl+I to open the indicator list, select your tool, and click "Properties" to change colors, levels, or visual styles.
4. Updating: Replace the old file in the Indicators folder with the new version and restart the platform to apply changes.
Frequently Asked Questions
Q: Why is my indicator not showing? A: Verify the file is in the MQL/Indicators folder, or try right-clicking the "Indicators" tree in the Navigator and clicking "Refresh."
Q: Do custom indicators slow down the platform? A: Too many complex indicators can impact performance; remove unused ones via the "Indicator List" (Ctrl+I).
Q: Can I use MT4 indicators on MT5? A: No, MQL4 and MQL5 are distinct languages; ensure the indicator is compiled specifically for your platform version.
Description & Settings
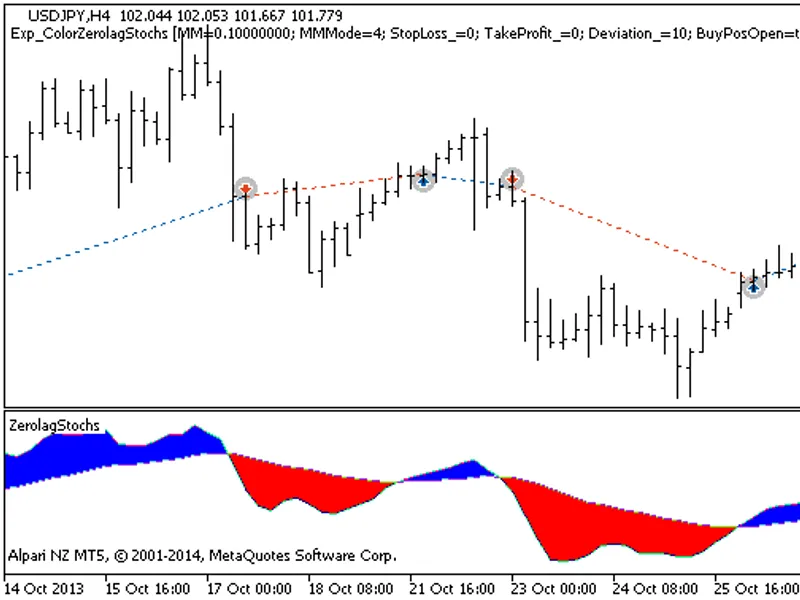
The indicator identifies consecutive High candles and consecutive Low candles. The first candle must have an (x) pip long adjustable body for the first condition to be met, the candle must also be below or equal to the 20 stochastic level for consecutive High candles or above or equal to the 80 stochastic level for consecutive Low candles. You can set your own stochastic levels.
If the above conditions are met, then the indicator looks at candle 2. Candle 2 must also have an (x) pip long adjustable body for the condition to be met, however, it is not dependent on the stochastic levels. If conditions for candle two are met then the indicator will send an alert just after candle 1 closes and place an arrow on the chart.
Inputs of interest
Minimum pip size for candle one. Pips in actual points, this is automatically converted for 4-digit brokers.
Minimum pip size for second candle.
Minimum pip size for third candle.
Turn on push notifications?
Turn on popup notifications?
Arrow? Choose between Trend_Trading, Range_Trading, or No_Arrows.
Candles before alert. Options are two or three
Verbose = Turn details on or off in Expert Tab
KPeriod = 5
Slowing = 3
DPeriod = 3
MAMethod = sma
PriceField = close/close
overBought = 80
overSold = 20
BuyColor = Green
SellColor = Red
For the purpose of clarity, let us divide trading styles into two types
trend
or
range
. With trend trading, if the price is going up you expect when you place your trade for it to continue in the same direction. With range trading, you expect the price to reverse so you place a trade in the opposite direction of recent movement.
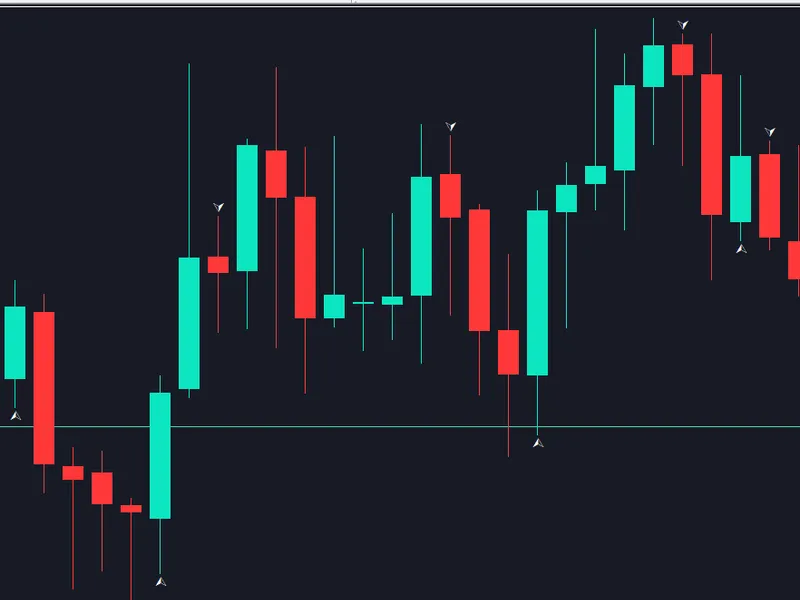
So for example if three large bullish bars print according to your pip size specification and the stochastic was overbought at the time of the first bar printing are you expecting price to continue going up, and thus would like an up arrow printed on the chart, or if range trading and you would want a print down arrow at that time expecting price to go lower now that it has been in overbought territory for some time.
Trend Mode Range Mode Some Inputs Verbose Mode