All In One Divergence
This professional-grade solution for MetaTrader 4 helps traders achieve greater efficiency in their daily workflow. This technical indicator acts as a specialized analysis tool designed to visualize market data. It helps traders identify emerging trends, momentum shifts, and key support or resistance levels by plotting statistical calculations directly onto price charts.
How to Setup and Use All In One Divergence
1. Installation: Place your file in the MQL/Indicators folder via "Open Data Folder" and restart your terminal.
2. Loading: Find the indicator in the Navigator, drag it onto your chart, and configure the input parameters in the popup window.
3. Customization: Press Ctrl+I to open the indicator list, select your tool, and click "Properties" to change colors, levels, or visual styles.
4. Updating: Replace the old file in the Indicators folder with the new version and restart the platform to apply changes.
Frequently Asked Questions
Q: Why is my indicator not showing? A: Verify the file is in the MQL/Indicators folder, or try right-clicking the "Indicators" tree in the Navigator and clicking "Refresh."
Q: Do custom indicators slow down the platform? A: Too many complex indicators can impact performance; remove unused ones via the "Indicator List" (Ctrl+I).
Q: Can I use MT4 indicators on MT5? A: No, MQL4 and MQL5 are distinct languages; ensure the indicator is compiled specifically for your platform version.
Description & Settings
As per users' requests in comments, some improvements were made, specifically:
Inputs to enable/disable each alert type separately.
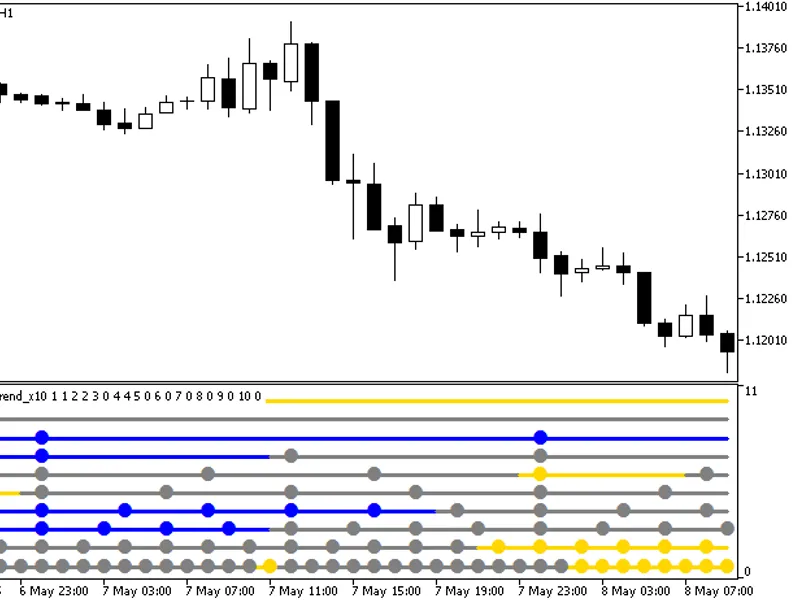
Dropdown list of 30 indicators with real names instead of numbers.
Signal buffer (Indicator output value).
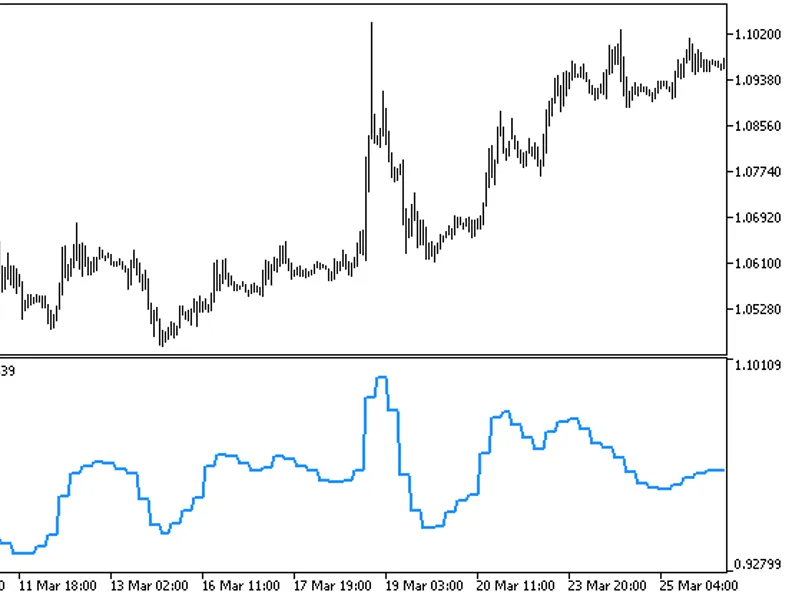
Indicator is compatible with , you can import it, create your own automated strategy and backtest with high precision (). Adjustable Parameters
Osc=29
- the number of the oscillator.
TH=true
- bearish divergence.
TL=true
- bullish divergence.
trend=true
- support/resistance lines.
convergen = true
- hidden divergence.
Complect = 1
- the distinguishing index of the indicator on the chart.
BackSteph = 0
- number of steps back h.
BackStepl = 0
- number of steps back l.
BackStep = 0
- number of steps back.
qSteps = 1
- number of displayed steps, no more than three.
LevDPl = 5
- DeMark level points (2 = the central bar will be above (below) the two bars on the left).
LevDPr = 1
- DeMark level points (2 = the central bar will be above (below) the two bars on the right).
period = 8
- period for iADX, iATR, iBearsPower, iBullsPower, iCCI, iDeMarker, iForce, iMomentum, iMFI, iRVI, iStdDev, iRSI, iRSI, iWPR.
ma_method = 0
- averaging method for iStochastic, iStdDev, iForce.
ma_shift = 0
- MA shift for iStdDev.
applied_price = 4
- applied price for iRSI, iRSI, iStdDev, iOBV, iOsMA, iMACD, iMomentum, iForce, iCCIiBullsPower, iBearsPower, iADX.
mode=0
- line index for iStochastic, iRVI, iMACD, iADX.
fast_ema_period = 12
- fast MA period for iOsMA, iMACD.
slow_ema_period = 26
- slow MA period for iOsMA, iMACD.
signal_period = 9
- signal line period for iOsMA, iMACD.
Kperiod = 13
- K line period for iStochastic.
Dperiod = 5
- D line period for iStochastic.
slowing = 3
- slowing for iStochastic.
price_field = 0
- applied price for iStochastic.
showBars = 1000
- if = 0, the indicator is displayed for the entire chart.
Trend_Down = true
- resistance lines.
Trend_Up = true
- support lines.
TrendLine = true
- support/resistance lines.
HandyColour = true.
Highline = Red
- HL channel color.
Lowline = DeepSkyBlue
- LL channel color.
ChannelLine = false
- channels parallel to trend lines.
Trend = 0
- 1 = only for UpTrendLines, -1 = only for DownTrendLines, 0 = for all TrendLines.
Channel = false
- channels.
Regression = true - Linear Regression Channel, false
- Standard Deviation Channel.
RayH = true
- ray for the High channel.
RayL = true
- ray for the Low channel.
ChannelH = Red
- color of the High channel.
ChannelL = DeepSkyBlue
- color of the Low channel.
STD_widthH = 1.0
- deviation size for the CHANNEL High object.
STD_widthL = 1.0
- deviation size for the CHANNEL Low object.
comment = false
- display comments.
code = 159
- character code of the Wingdings font to display the extremums.
BuyStop = false
- BuyStop levels.
SellLimit = false
- SellLimit levels.
SellStop = false
- SellStop levels.
BuyLimit = false
- BuyLimit levels.
Alerts = false
- Enable/Disable trading alerts.
Push = false
- Enable/Disable push trading alerts. Examples Recommendations
Change the Complect parameter when attaching more than one indicator to the chart.
Thank you for reading!