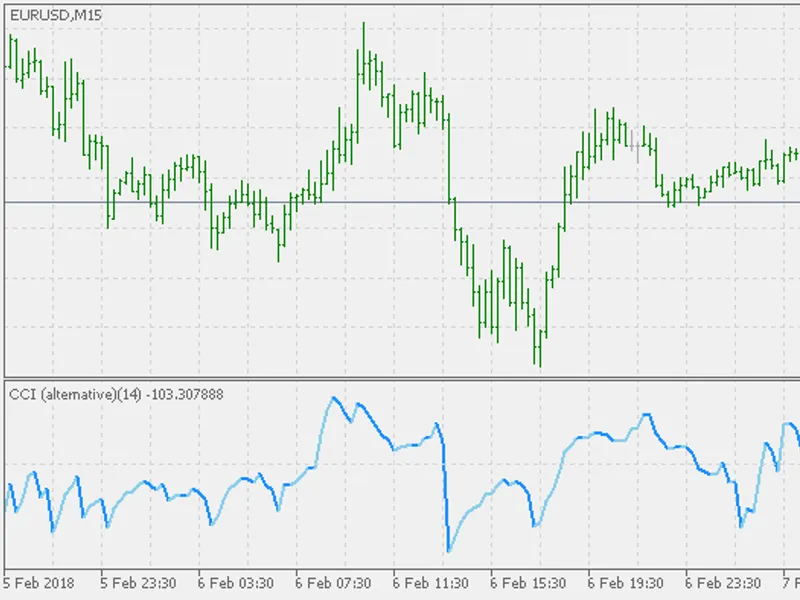
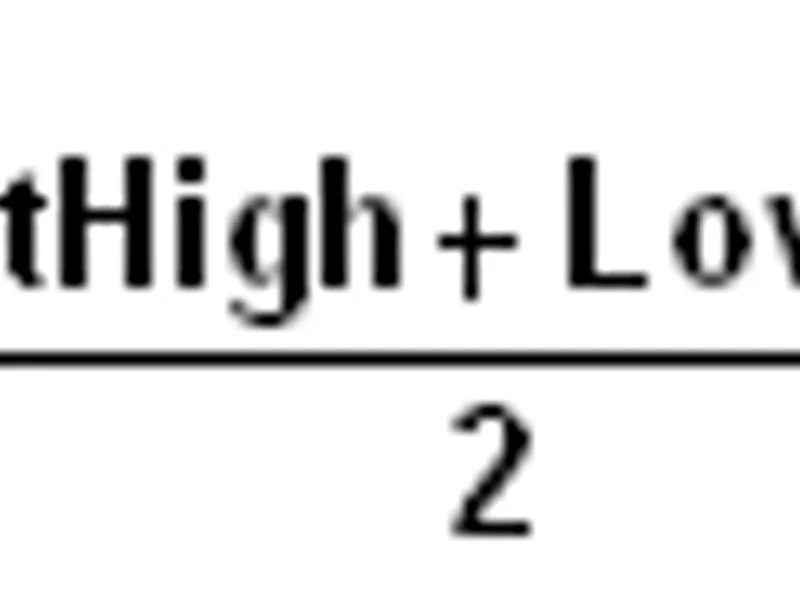
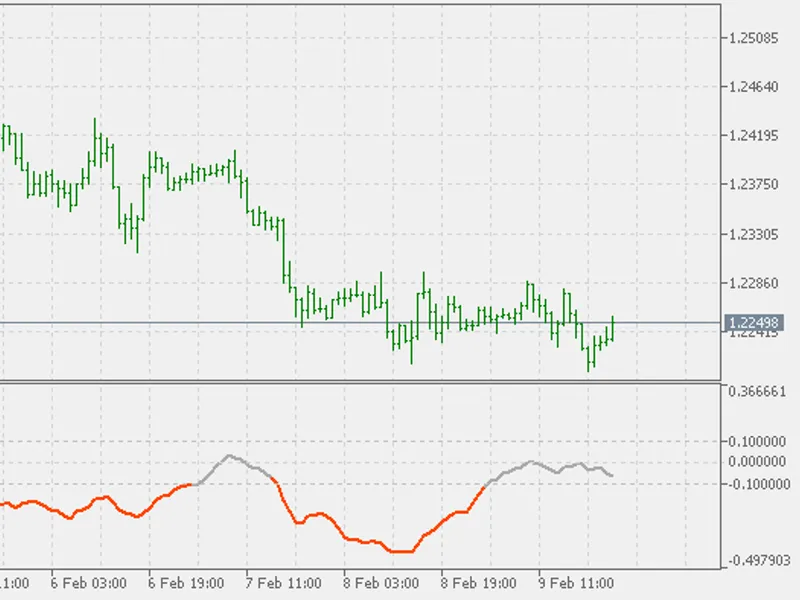
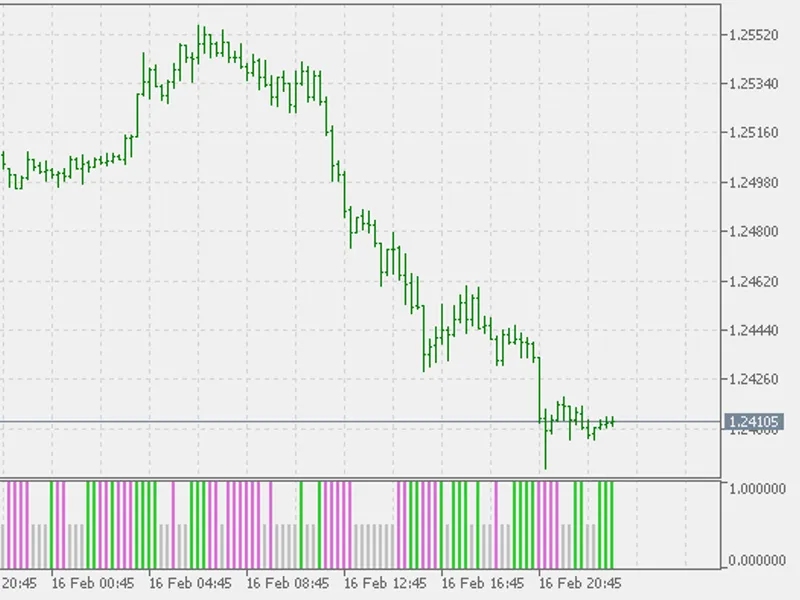
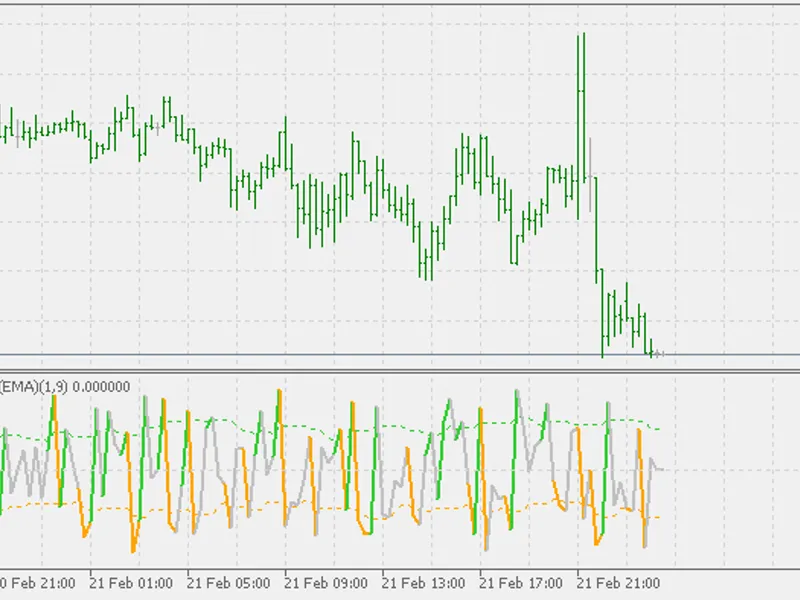
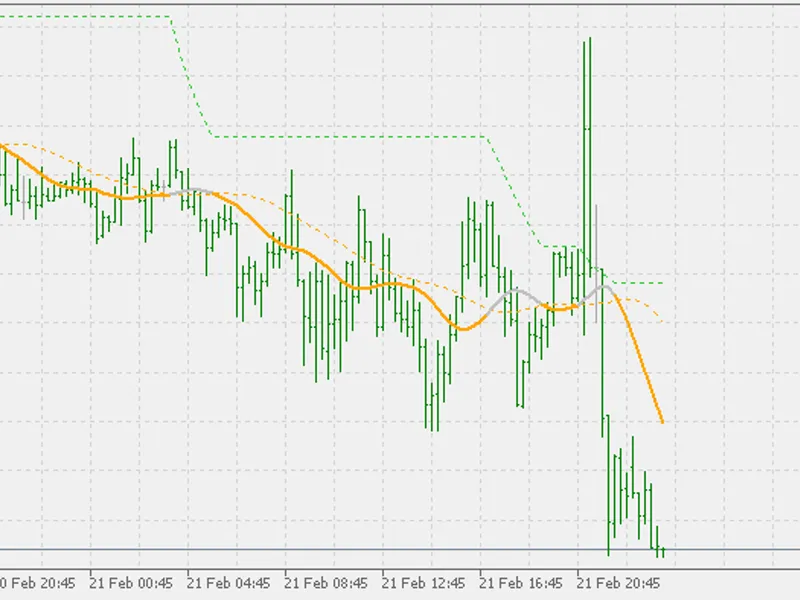
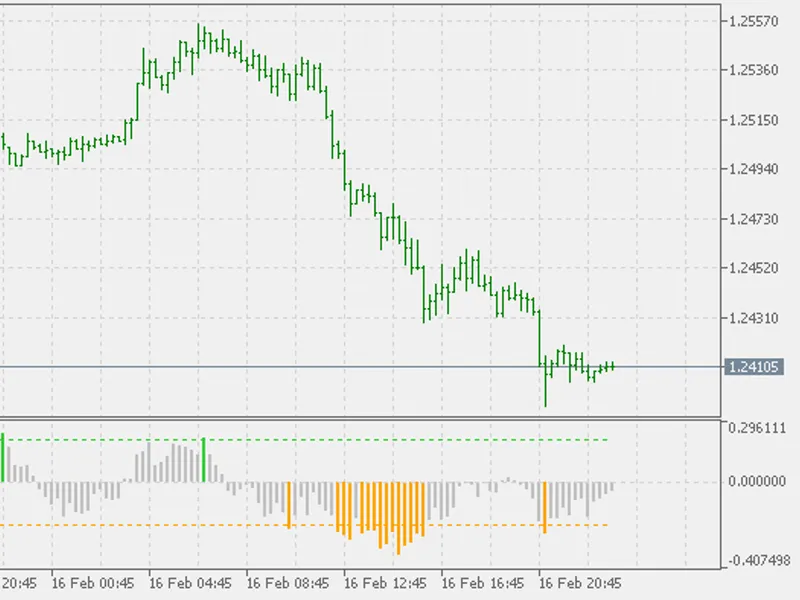
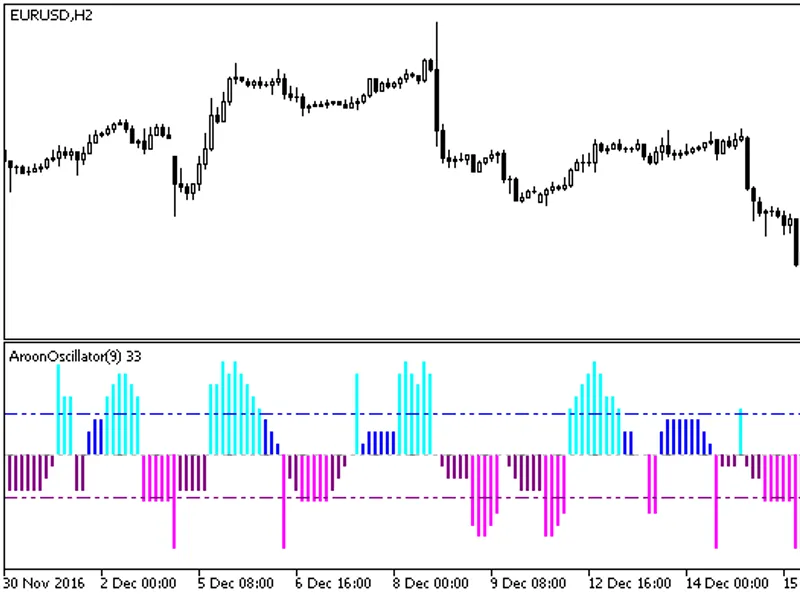
developed by donald lambert and featured in "commodities" magazine in 1980, the commodity channel index (cci) is a versatile indicator that can be used to identify a new trend or w...
the kijun-sen is a major indicator line and component of the ichimoku kinko hyo indicator, also known as the ichimoku cloud. it is generally used as a metric for medium-term moment...
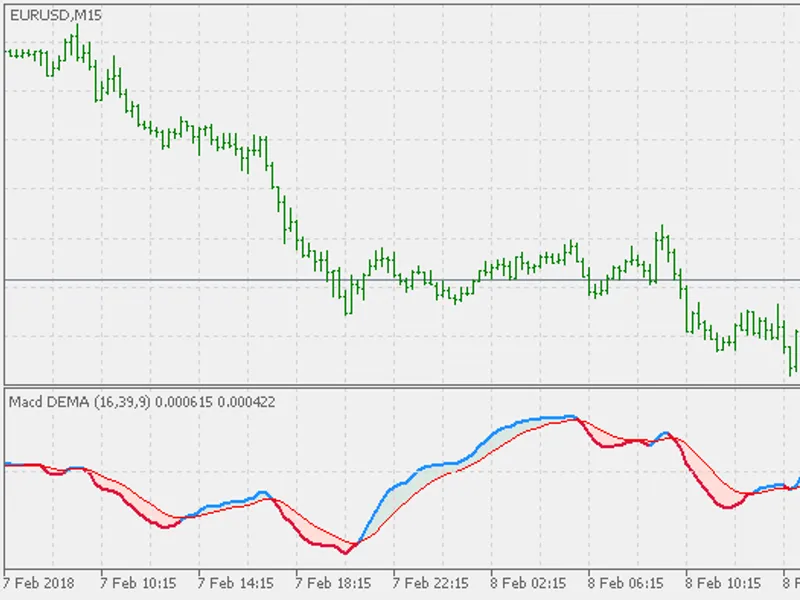
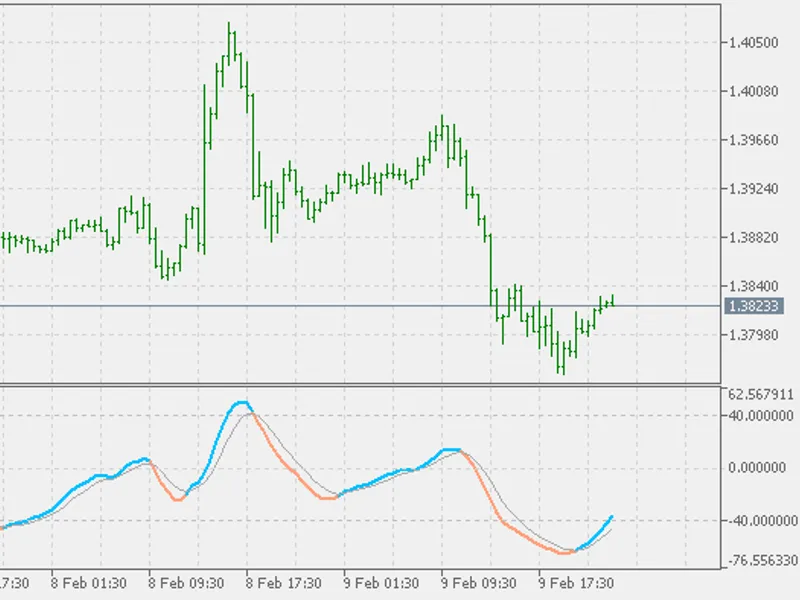
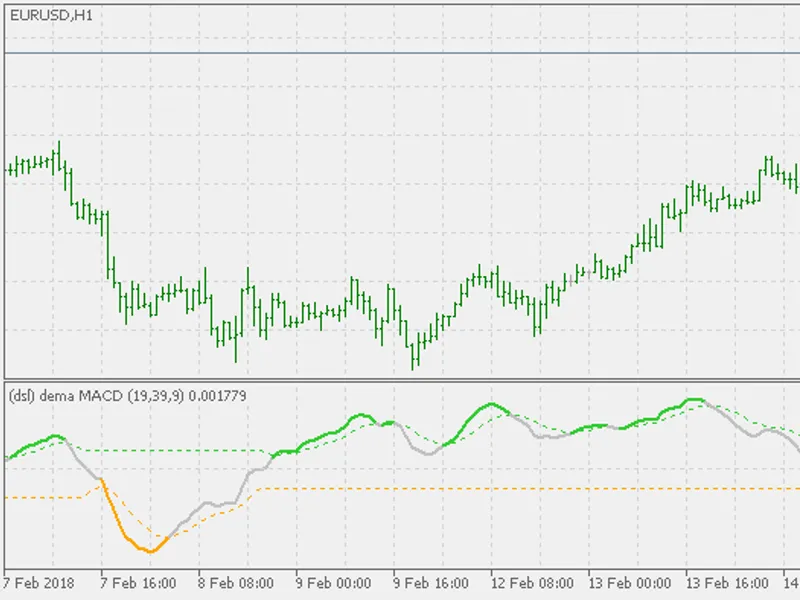
in his tasc january 1994 article "smoothing data with faster moving averages", patrick mulloy describes a macd that does not use ema for macd calculation but uses dema (double expo...
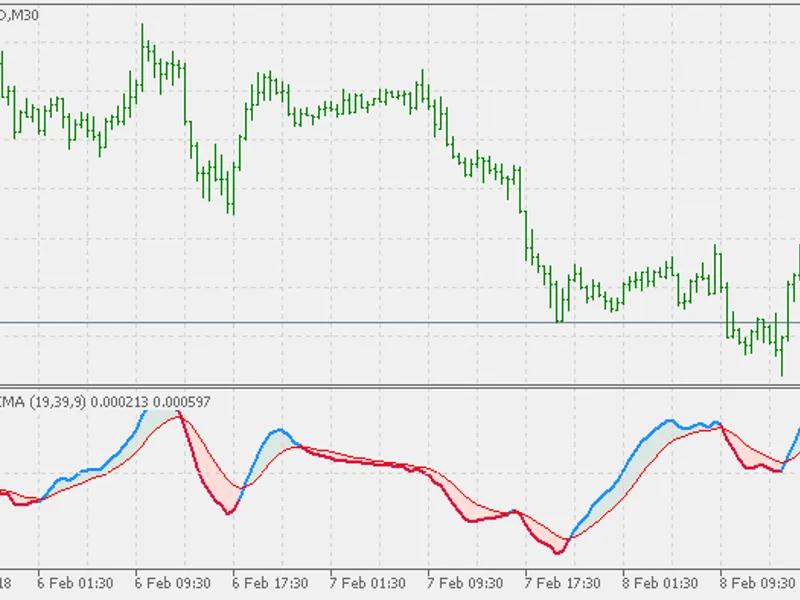
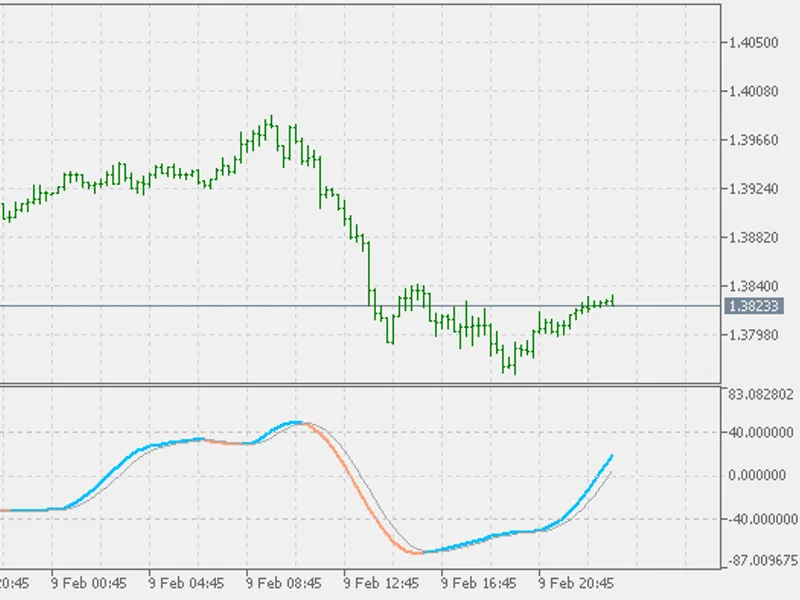
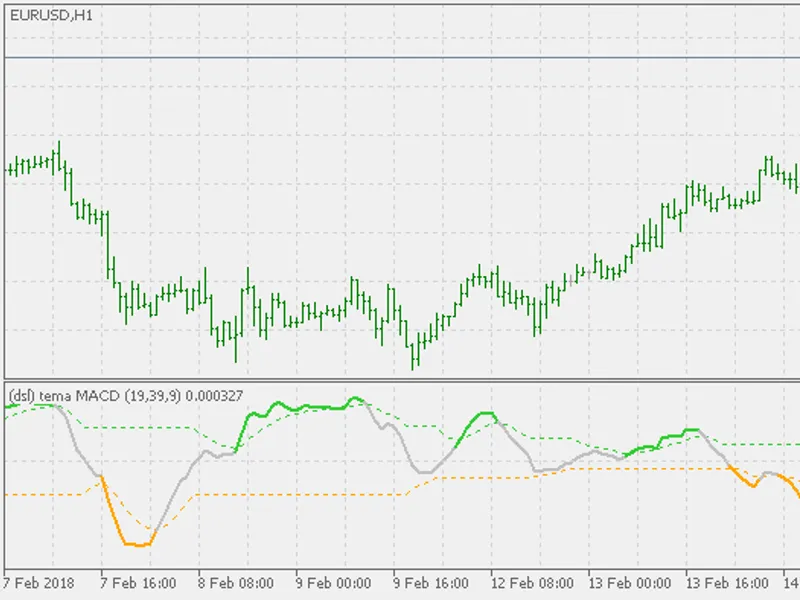
in an article "smoothing data with less lag" that was a continuation of his research for less lag signaling macd, patrick mulloy decided to use tema (triple exponential moving aver...
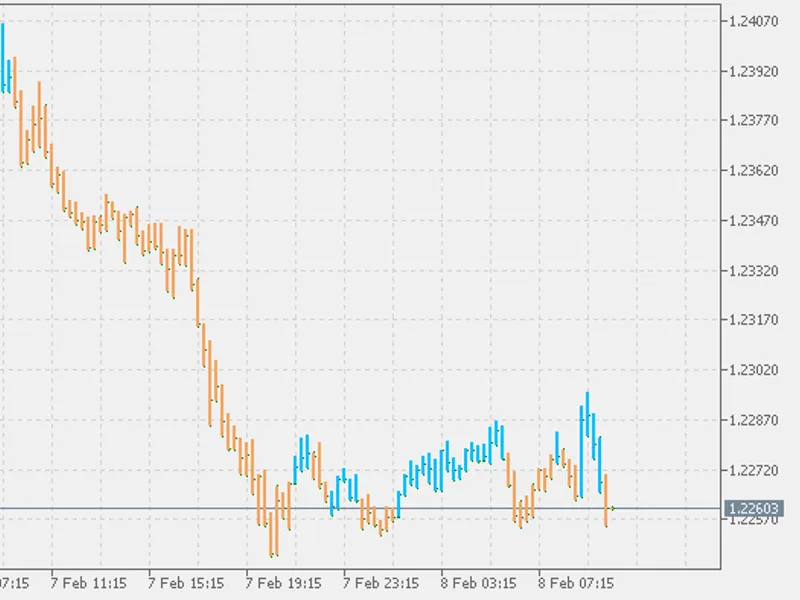
there is already one in the code base, but this one is doing the calculation in a different way.the ttm (trade the markets) trend is basically an easier way to look at candlesticks...
the efficiency ratio (er) was first presented by perry kaufman in his 1995 book "smarter trading". it is calculated by dividing the price change over a period by the absolute sum o...
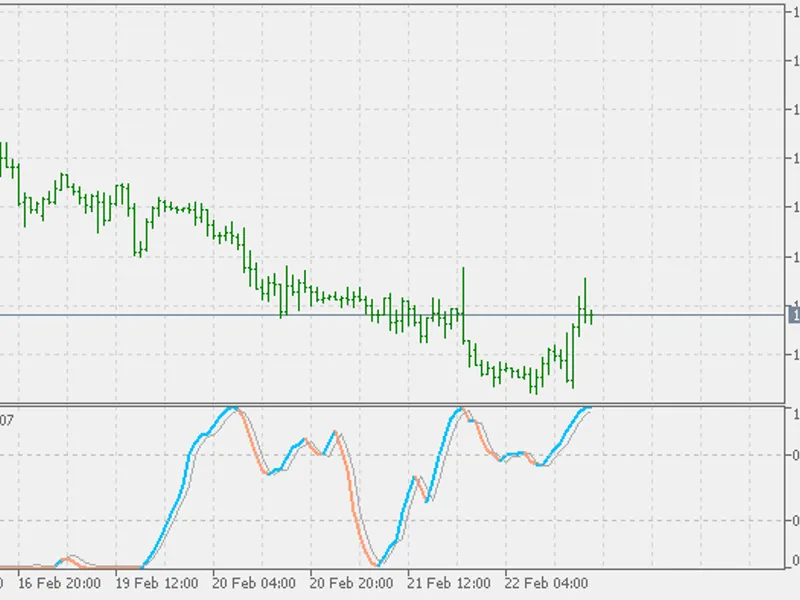
the stochastic momentum index (smi) was developed by william blau and was introduced in the january 1993 issue of technical analysis of stocks & commodities magazine.it incorpo...
the stochastic momentum index (smi) was developed by william blau and was introduced in the january 1993 issue of technical analysis of stocks & commodities magazine.it incorpo...
the stochastic oscillator is a momentum indicator comparing the closing price of a security to the range of its prices over a certain period of time. the sensitivity of the oscilla...
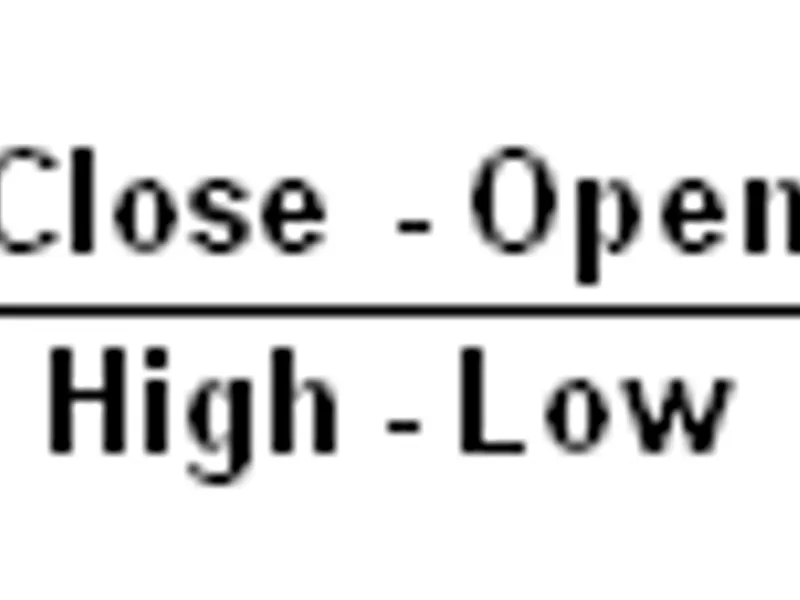
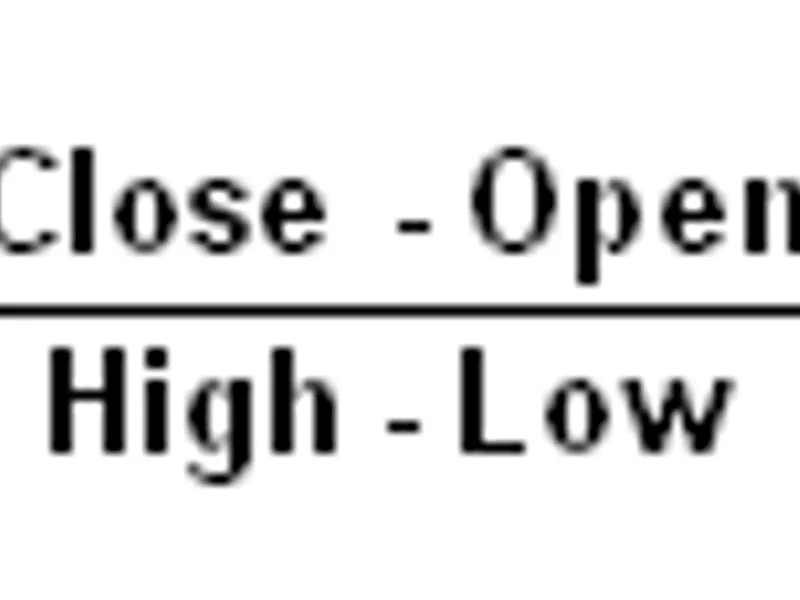
relative vigor index (rvi) indicator is used in technical analysis to measure the conviction of a recent price action and the likelihood that it will continue. the rvi compares the...
relative vigor index indicator used in technical analysis to measure the conviction of a recent price action and the likelihood that it will continue. the rvi compares the position...
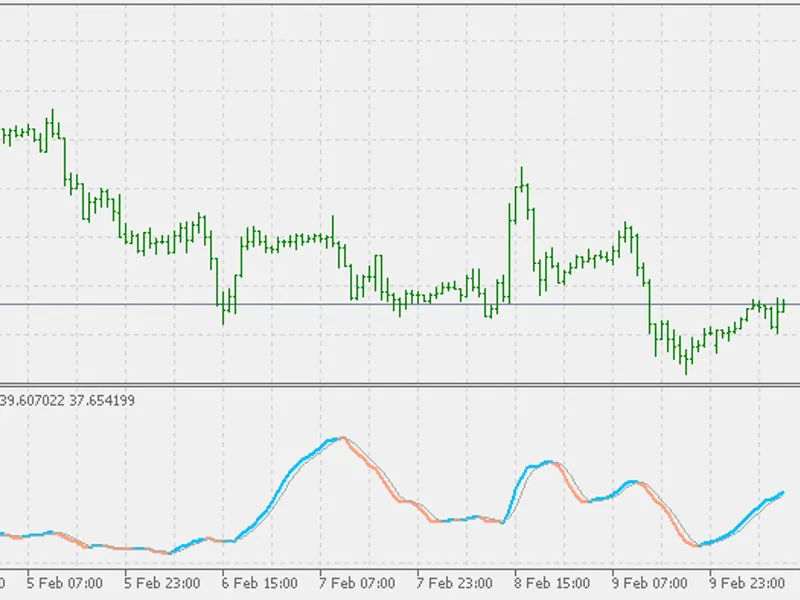
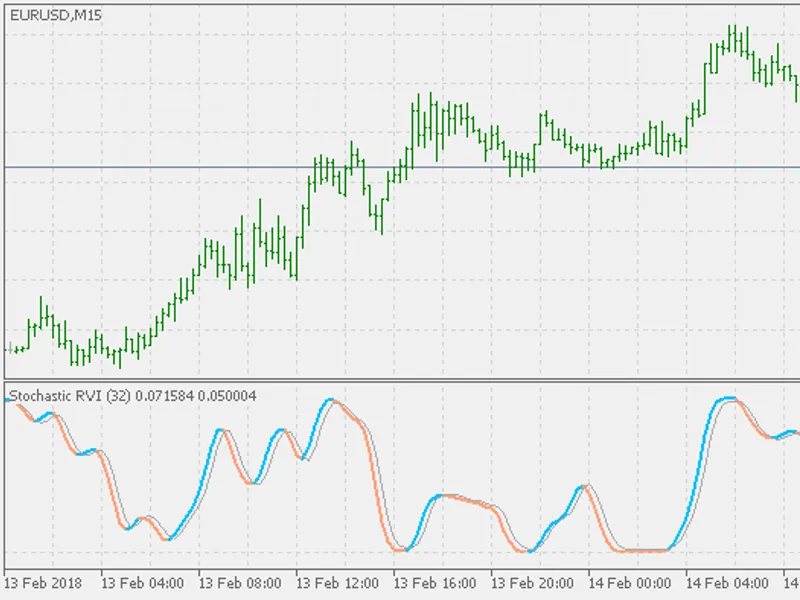
stochastic and rvi (relative vigor index) - both indicators measure overbought and oversold area of the market movement.this indicator combines them both in one single indicator - ...
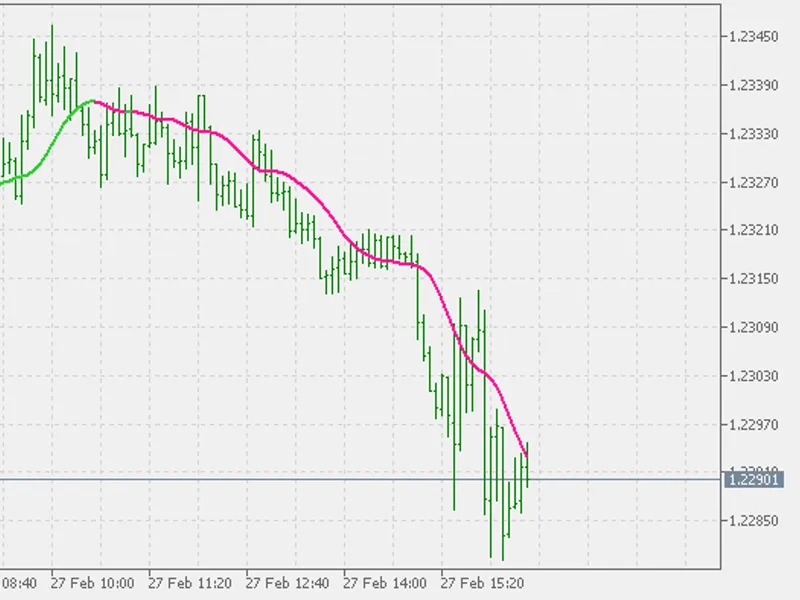
variation of a long known and useful macd indicator.dema (double exponential moving average) instead of using ema (exponential moving average) for macd calculation. dsl (discontinu...
variation of a long known and useful macd indicator.tema (triple exponential moving average) instead of using ema (exponential moving average) for macd calculation dsl (discontinue...
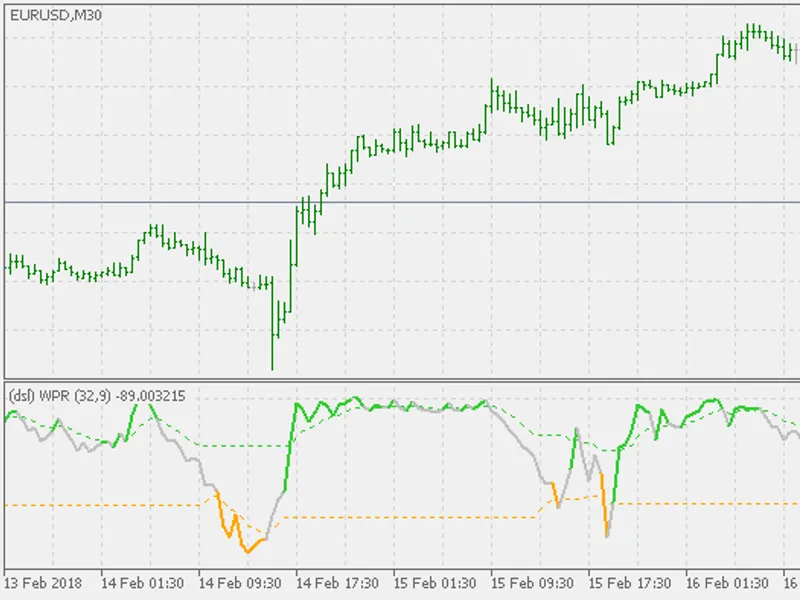
williams' percent range technical indicator (%r) is a dynamic technical indicator, which determines whether the market is overbought/oversold. williams' %r is very similar to the ....
the stochastic oscillator is a momentum indicator comparing the closing price of a security to the range of its prices over a certain period of time. the sensitivity of the oscilla...
the stochastic oscillator is a momentum indicator comparing the closing price of a security to the range of its prices over a certain period of time. the sensitivity of the oscilla...
one of the usual "games" every trader is doing in the trading time is finding out a best stop loss value for the order currently active.there are some good ways for dynamically doi...
indicator that is a combination of two bill williams' indicators.accelerator oscillator. awesome oscillator. the way how it works is simple - but seems to be producing usable resul...
the resulting raw bop values can be optionally smoothed using any moving average type.the bop oscillates between extremes of -1 and +1.but the "raw" bomp would be almost unusable i...
a different way of looking at the fractals: instead of showing fractals the usual way, this indicator shows fractals as an oscillator and can show the "rhythm" of the changes in th...
one of the natural ways to make the smoother and faster if necessary, is to use t3 instead of ema.t3 is very similar to ema in calculating way and it makes it suitable for this way...
the resulting raw bop values can be optionally smoothed using any moving average type.the bop oscillates between extremes of -1 and +1.livshin makes the following statements:for da...
demarker indicator is used in technical analysis to compare the most recent price action to the previous period's price in an attempt to measure the demand of the underlying asset....
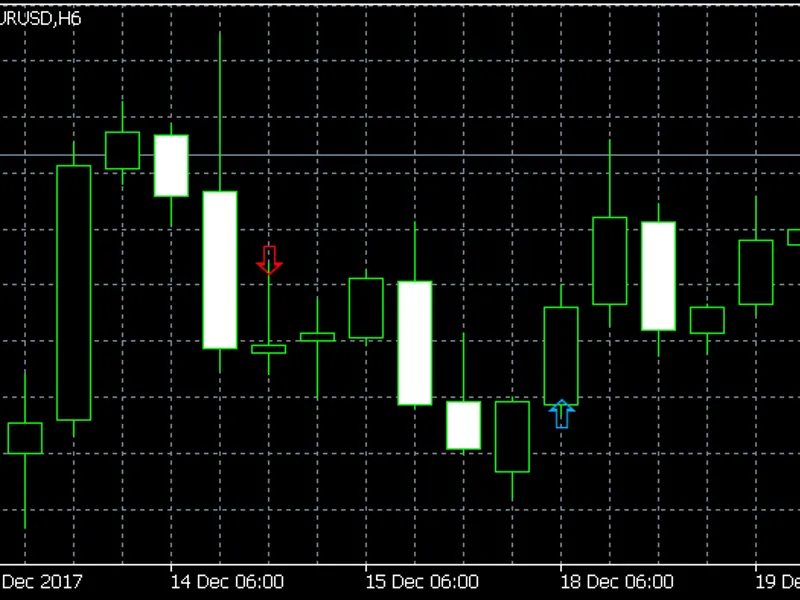
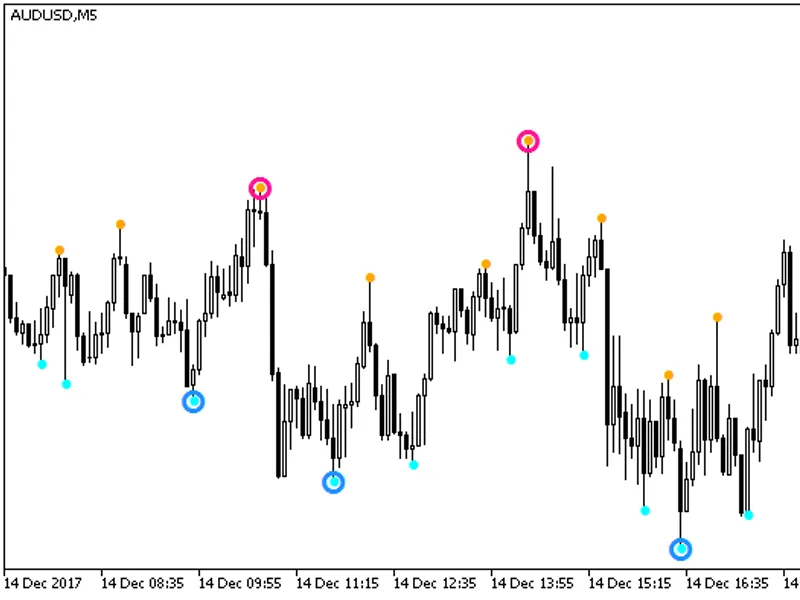
the indicator shows position opening signals based on the 'reversal' trading system.description of the system the system works best on the h6 timeframe. the idea of the system is a...
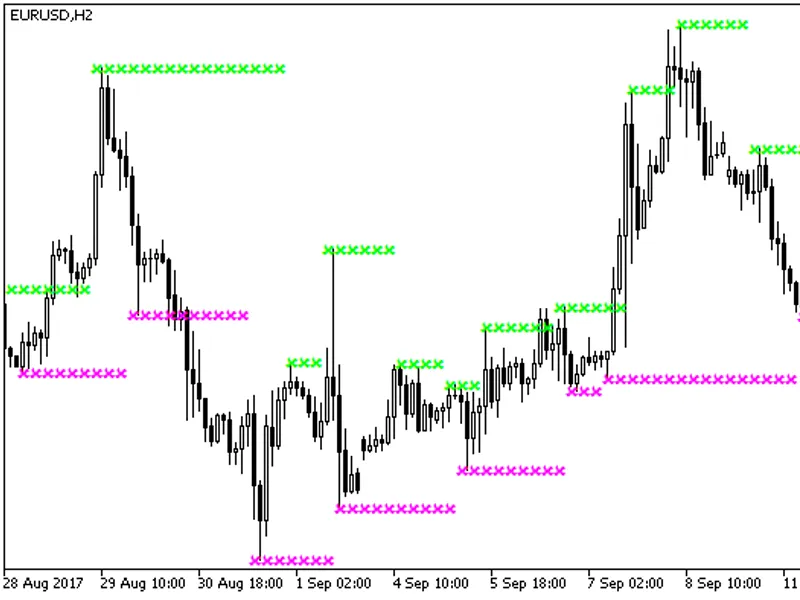
the indicator with the possibility to change the indicator timeframe in input parameters:the indicator requires the compiled support_and_resistance.ex5 indicator file. add it to &l...
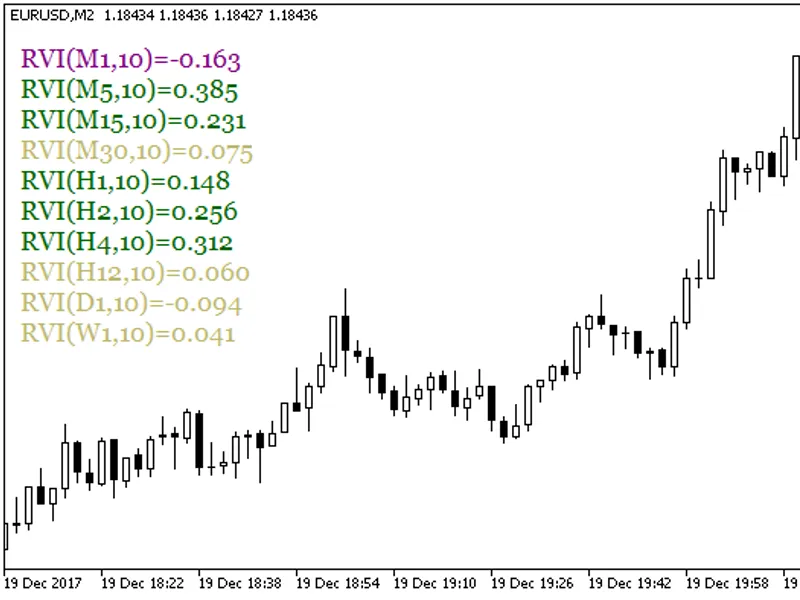
the indicator shows a text block with the values of the user defined oscillator period for each timeframe. the size of the text block is customizable. you can also change the tex...
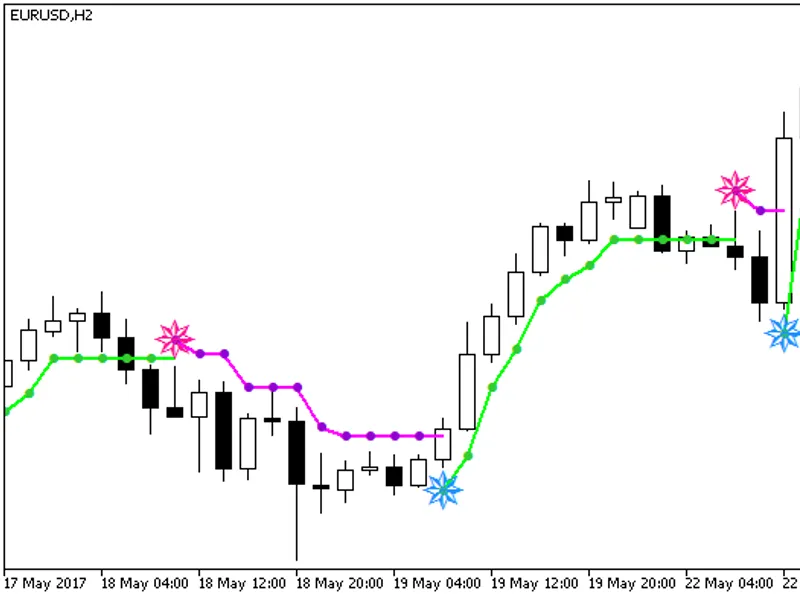
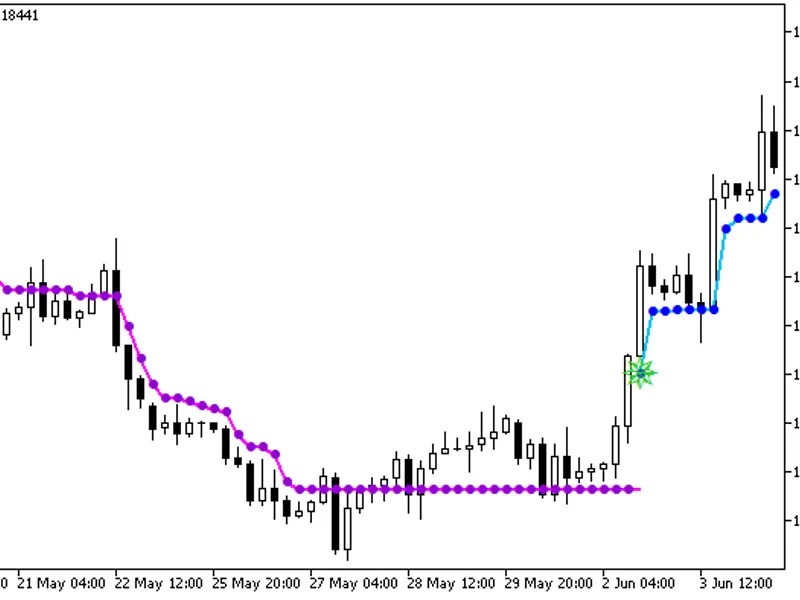
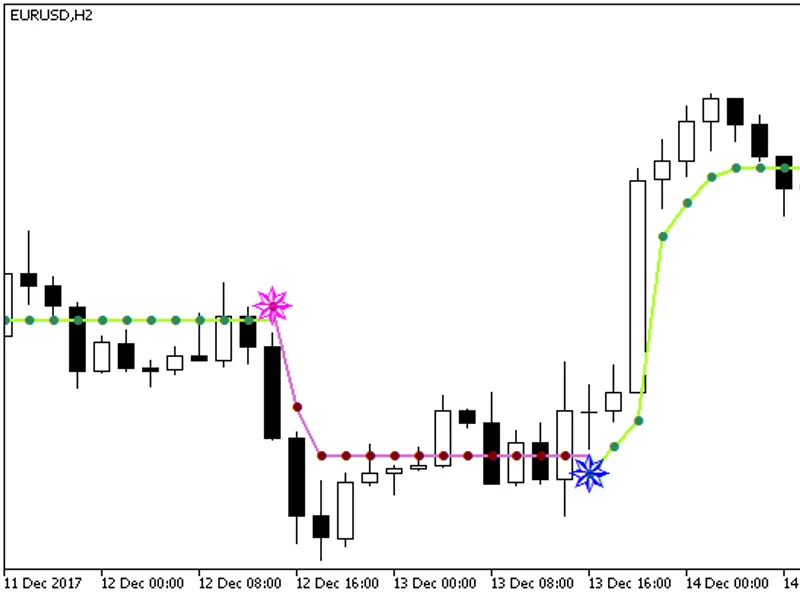
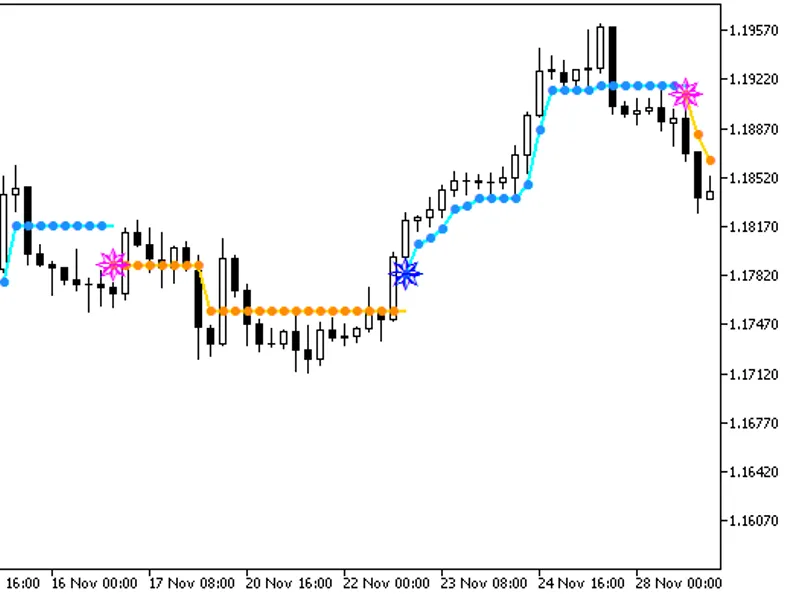
a semaphore signal indicator using the oscillator, which is similar to with an nrtr line based on the values of the atr indicator.the indicator uses smoothalgorithms.mqh library cl...
a semaphore signal indicator using the oscillator, which is similar to with an nrtr line based on the values of the atr indicator.the indicator uses smoothalgorithms.mqh library cl...
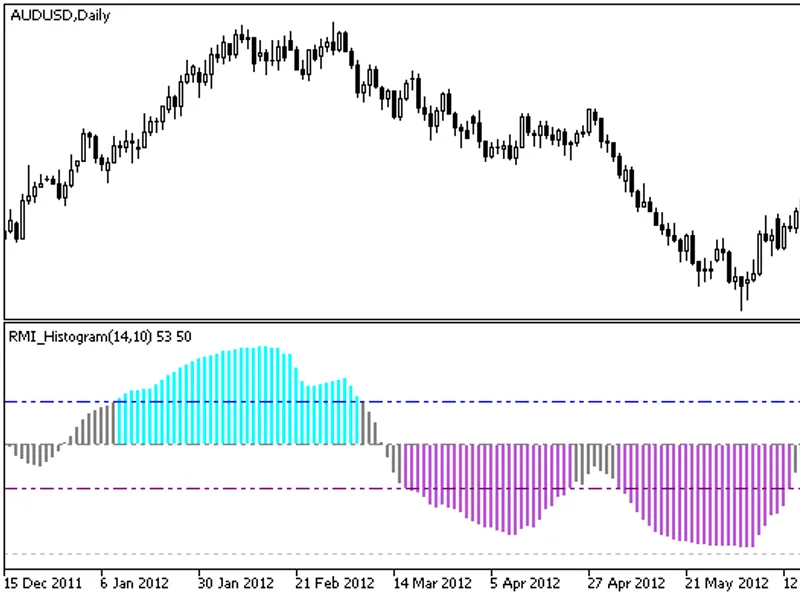
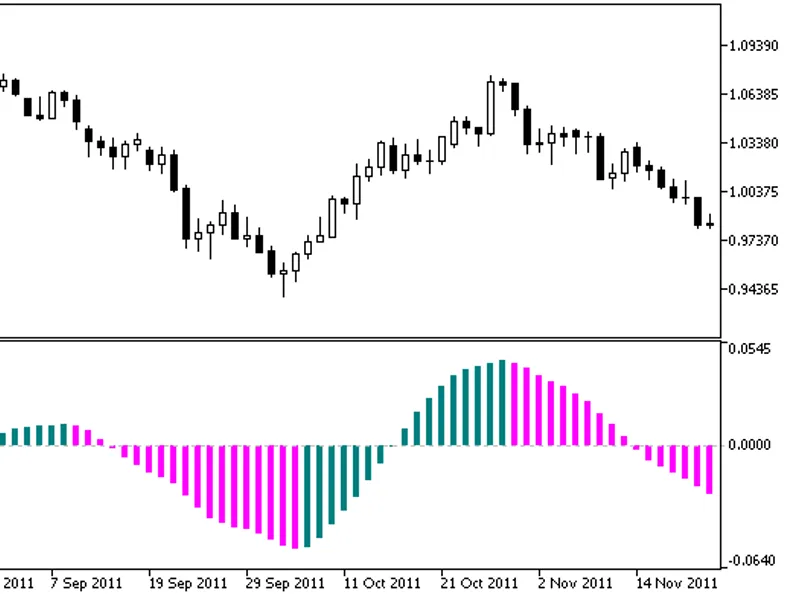
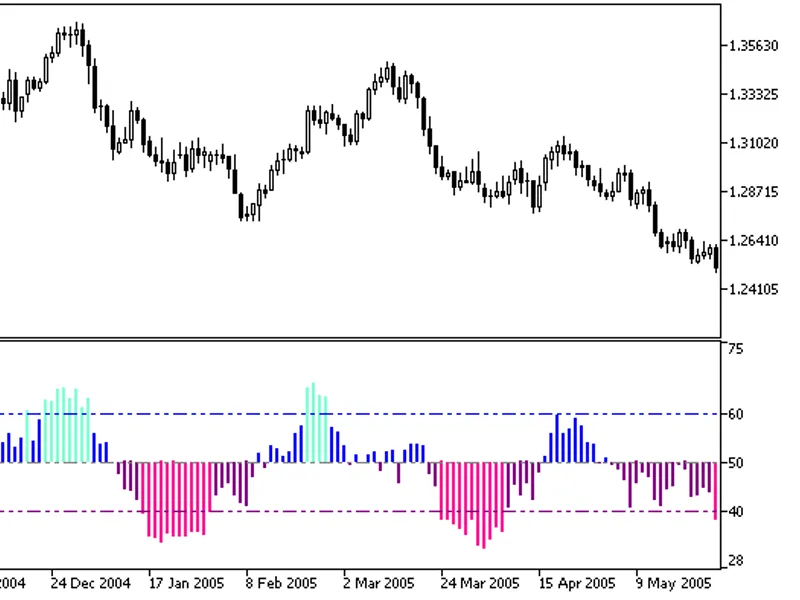
relative momentum index implemented as a color histogram with an indication of overbought and oversold zones.rmi (relative momentum index) was developed by roger altman and was fir...
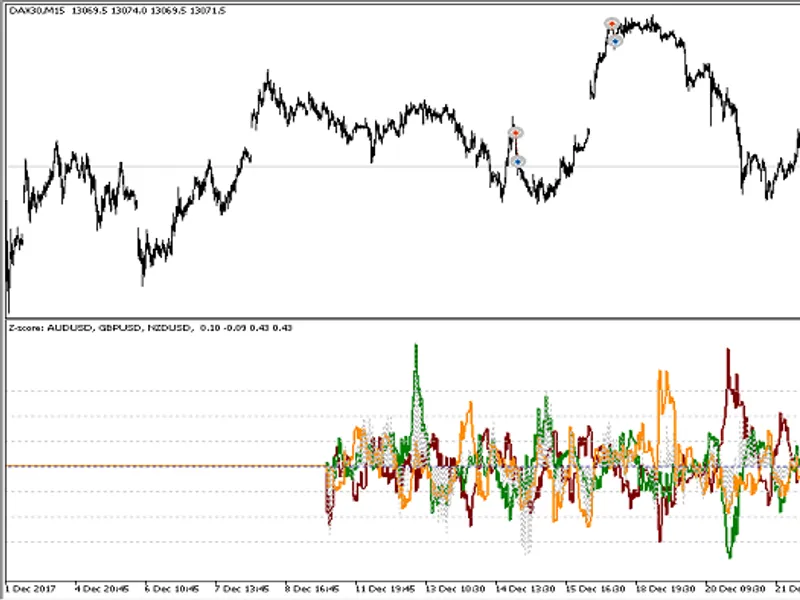
the indicator finds linear regression coefficients between each of the selected symbols and all other symbols, and displays them in the form of standard deviations. the sum of all ...
the smoothed s-roc indicator of the relative price increment by fred shutsman.the indicator is calculated using the next formula:s-roc= (ema [bar] – ema[bar - roc]) / ema[bar - roc...
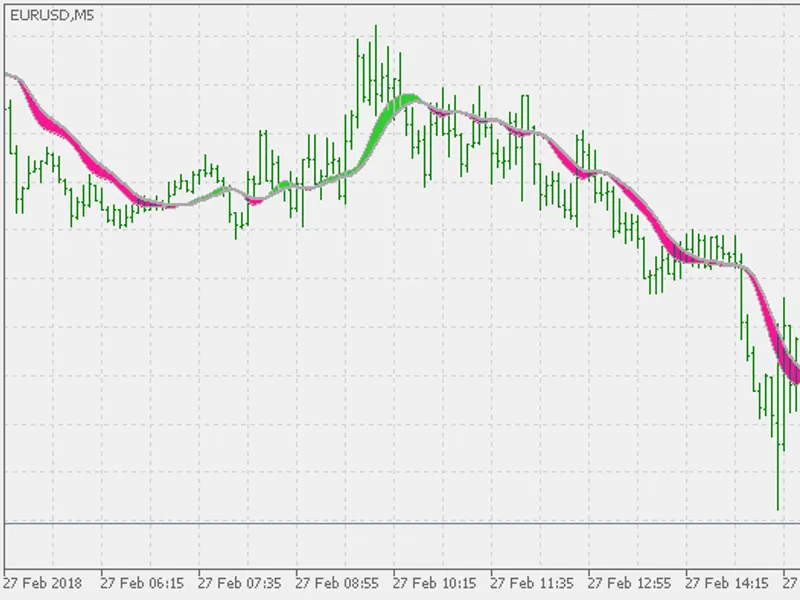
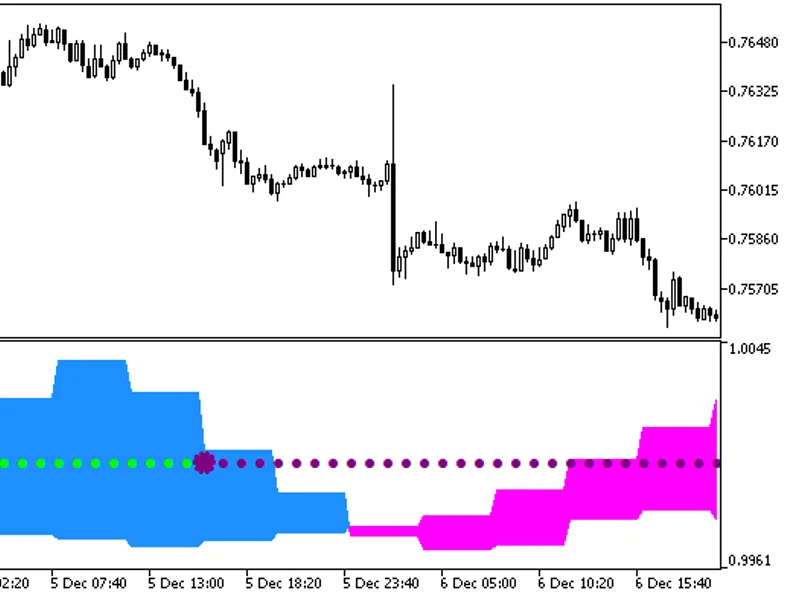
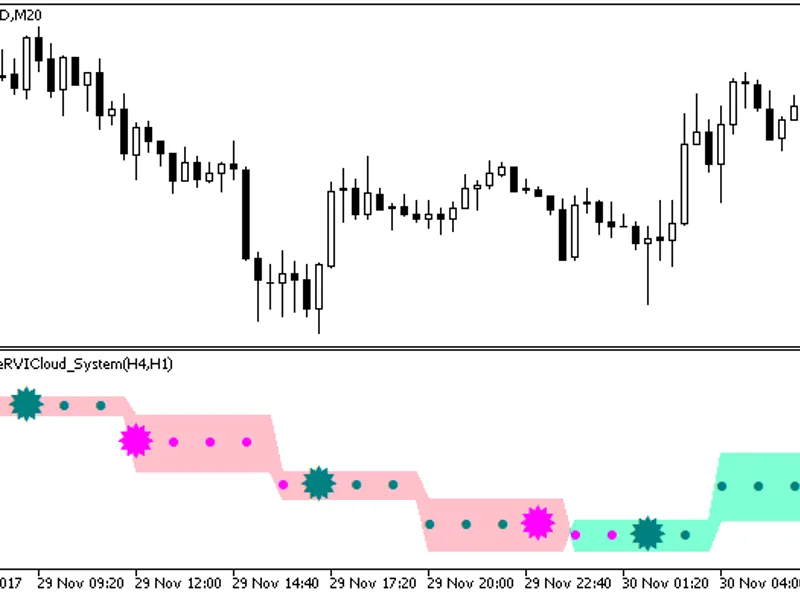
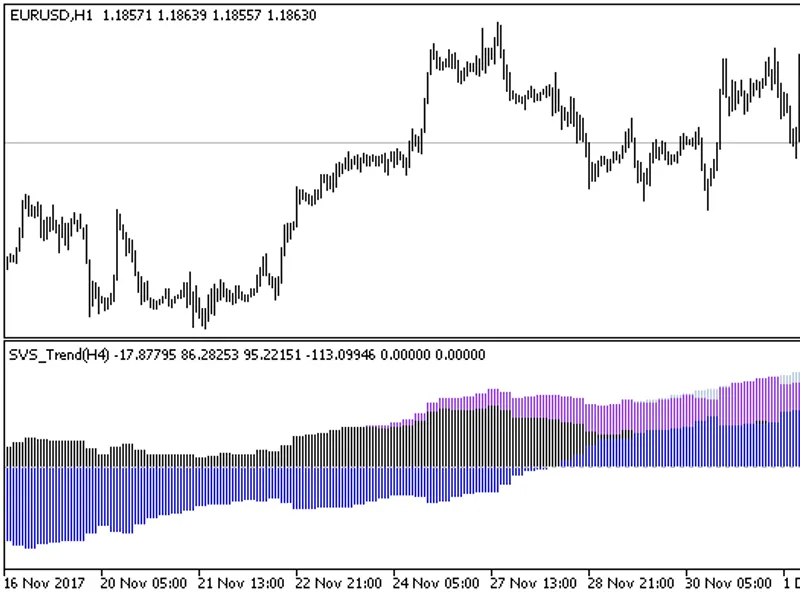
two indicators from different timeframes on one chart. the indicator of a larger timeframe is displayed as a color trend cloud, which determines trend. the second indicator of a sm...
two indicators from different timeframes on one chart. the indicator of a larger timeframe is displayed as a color trend cloud, which determines trend. the second indicator of a sm...
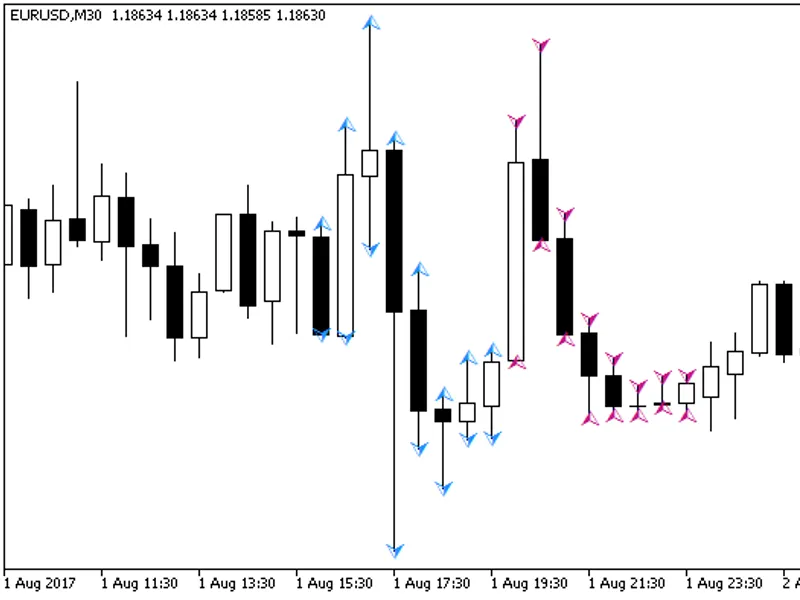
the indicator marks candlesticks with colored arrows if candlesticks of a higher timeframe selected in input parameters are higher or lower than previous candlesticks. it should be...
the indicator with the possibility to change the indicator timeframe in its input parameters:the indicator requires the compiled svs_trend.ex5indicator file. add it to <terminal...
the indicator implemented in the form of a colored histogram.the indicator uses smoothalgorithms.mqhlibrary classes (copy it to <terminal_data_folder>\mql5\include). the deta...
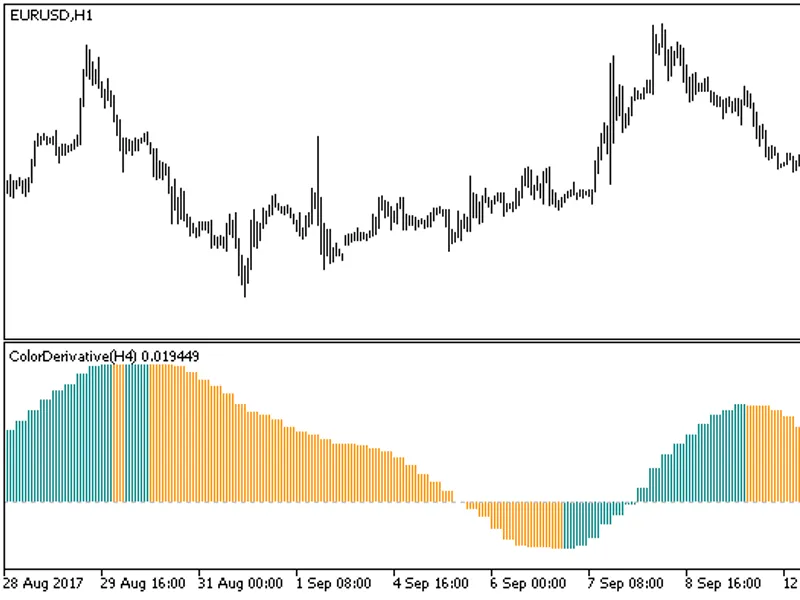
the indicator with the possibility to change the indicator timeframe in its input parameters:the indicator requires the compiled colorderivative.ex5indicator file. add it to <te...
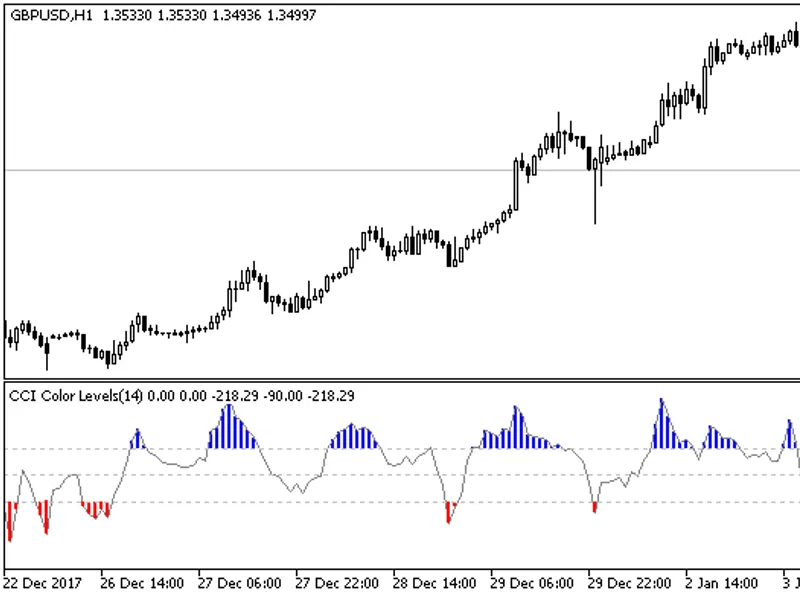
the indicator looks like this:three types of graphical constructions were used for this visual effect:("level up"); ("cci"); ("level down"). indicator input averaging period- ind...
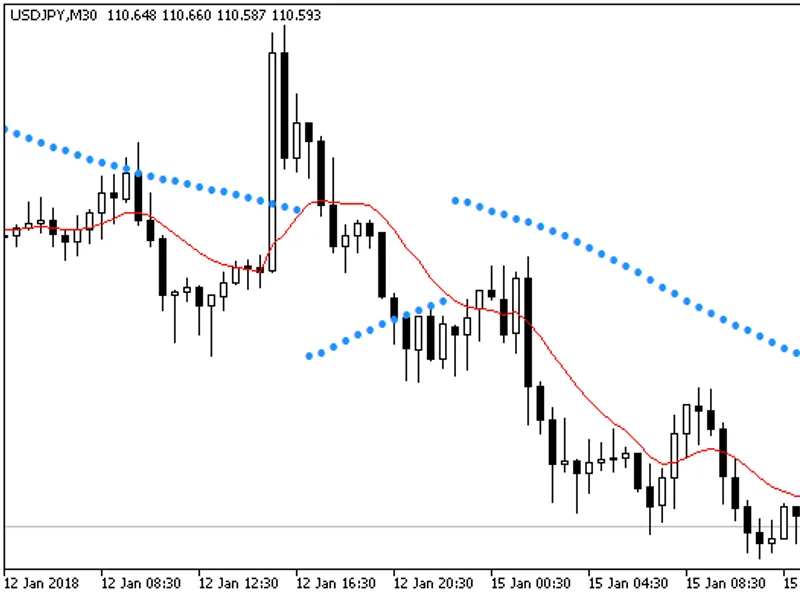
the idea of this indicator is to replace the high and low prices with the moving average indicator values when calculating the sar indicator.the result is shown below:that is, di...