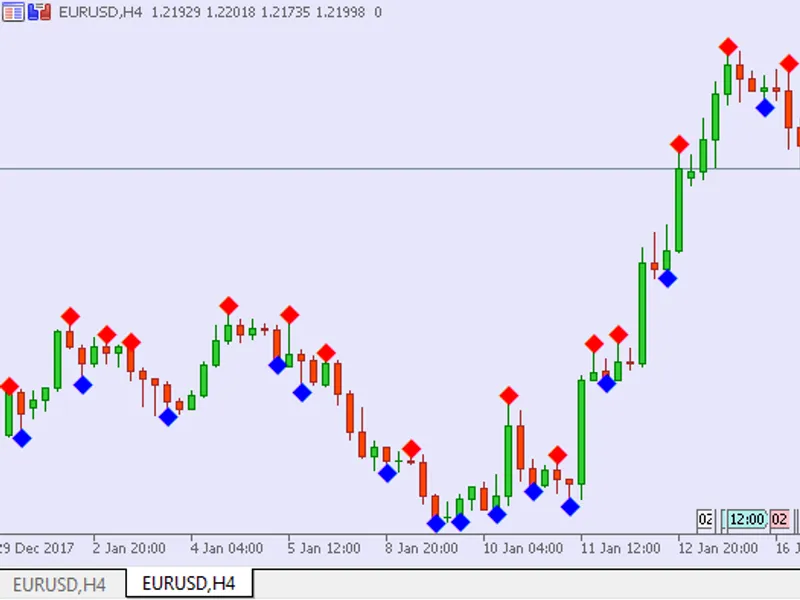
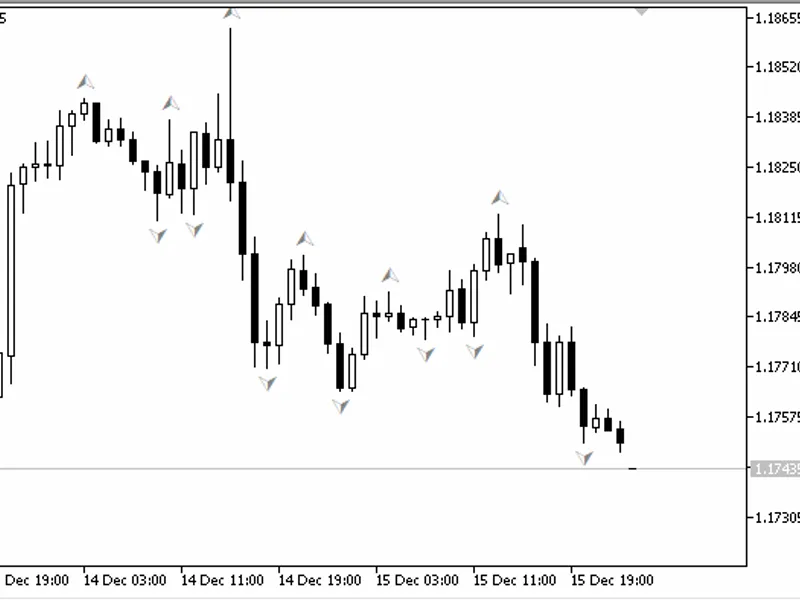
the indicator searches for fractals with arbitrary dimensions: 1x1, 2x2, 3x3, ... nxnit has only one input parameter:frames- the number of bars to the right and left of the central...
the indicator searches for candlesticks, which are larger than the specified size, and marks such candlesticks on the chart. it can also show an alert message, once the current can...
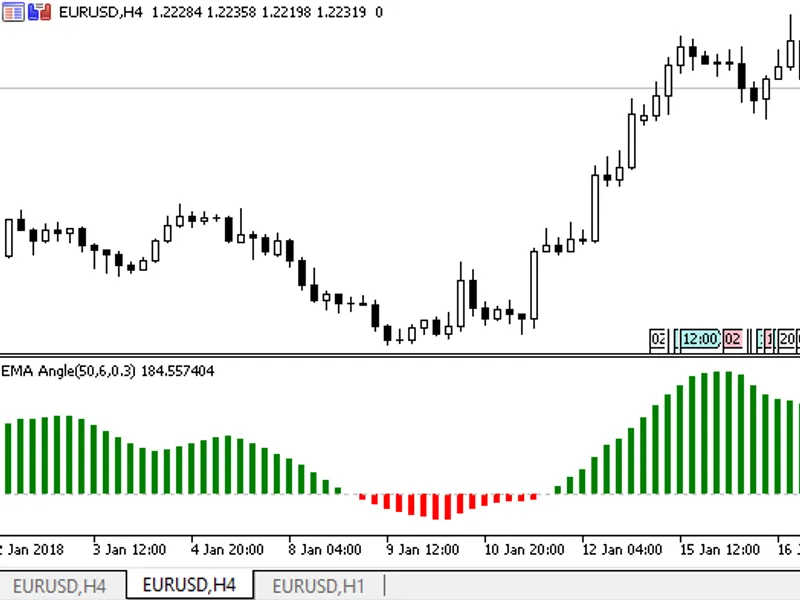
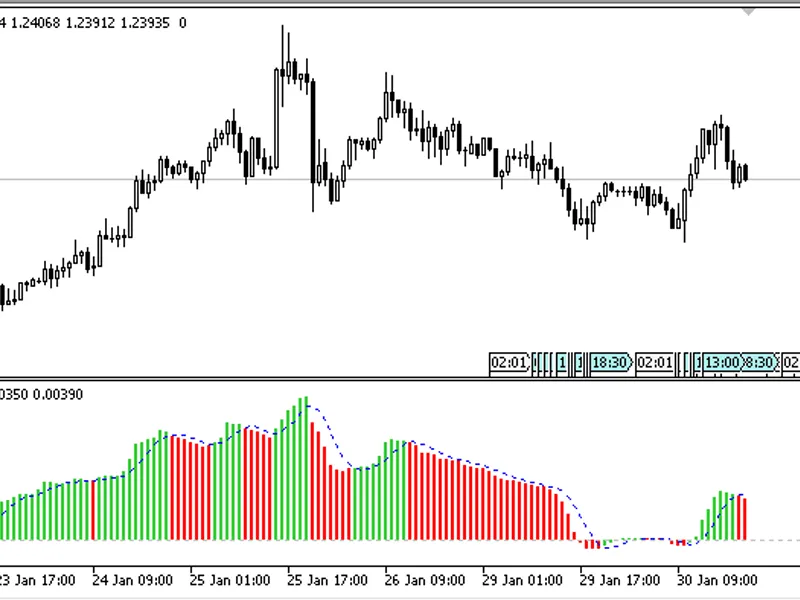
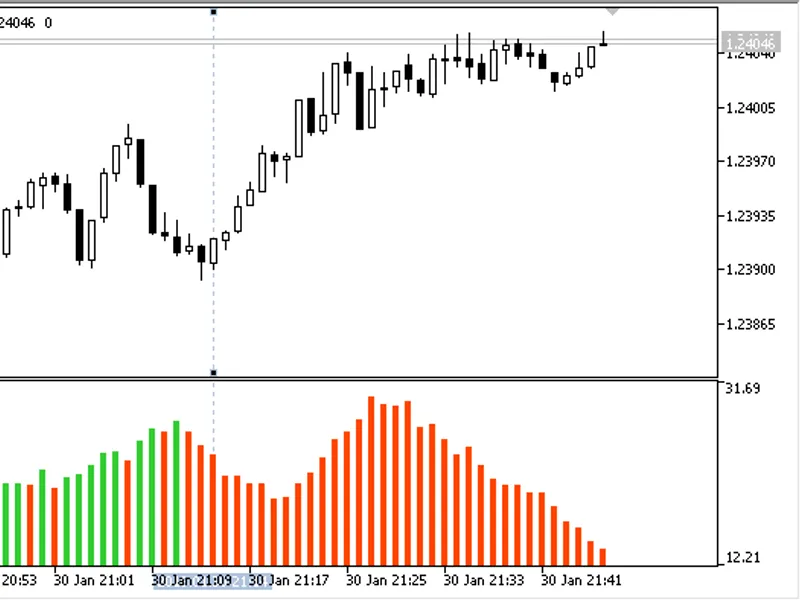
a simple oscillator. shows the difference between two exponential moving averages in the form of a colored histogram drawn in a separate window.there are three adjustable parameter...
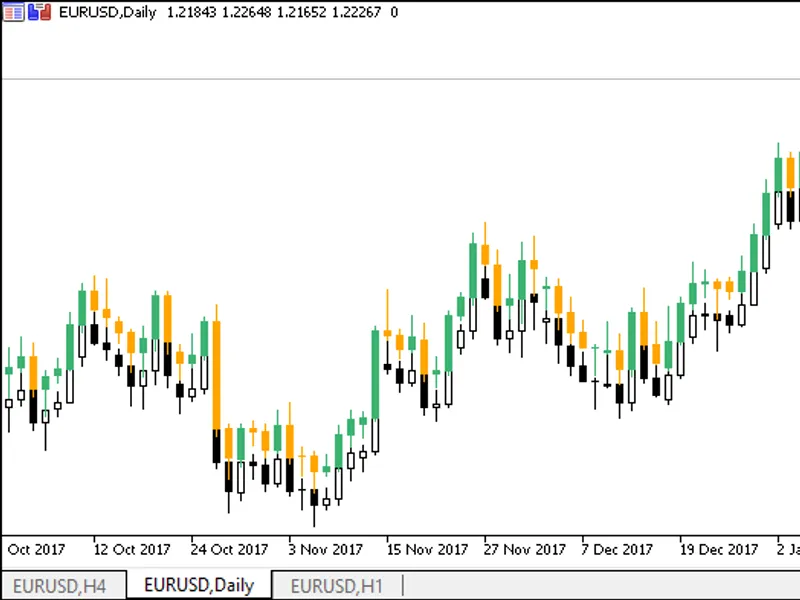
the indicator allows customizing the day beginning hour, the vertical shift of candlesticks, as well as colors of bullish, bearish and doji candlesticks.it has five input parameter...
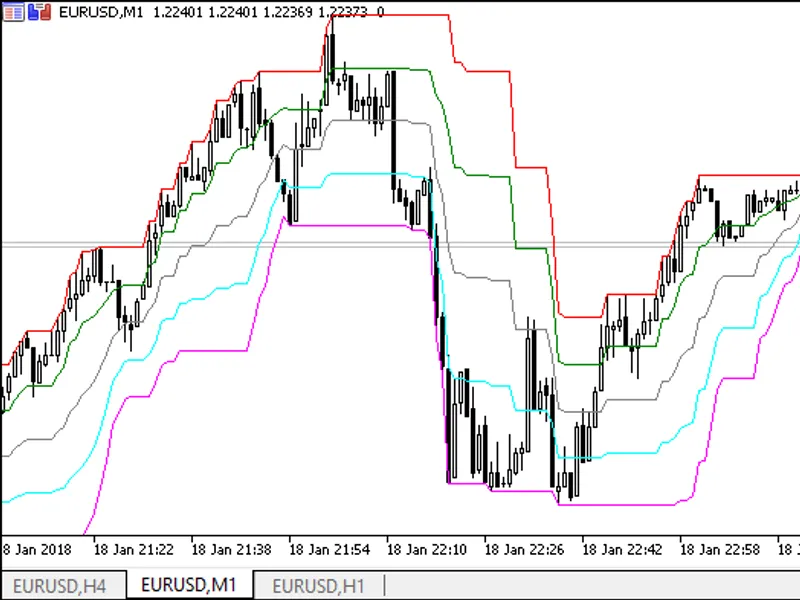
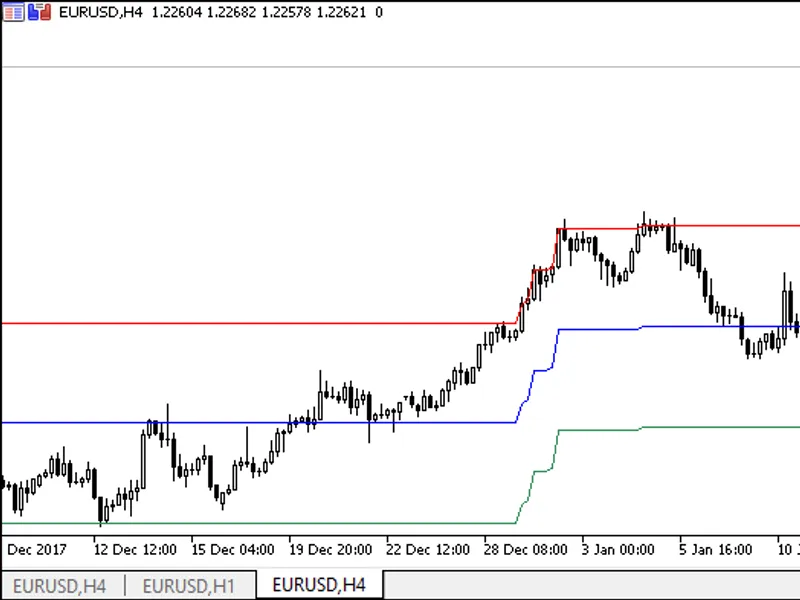
the indicator has only one adjustable parameter, which indicates how long the previous channel high and low borders should be shown.length of levels- the length of channel borders....
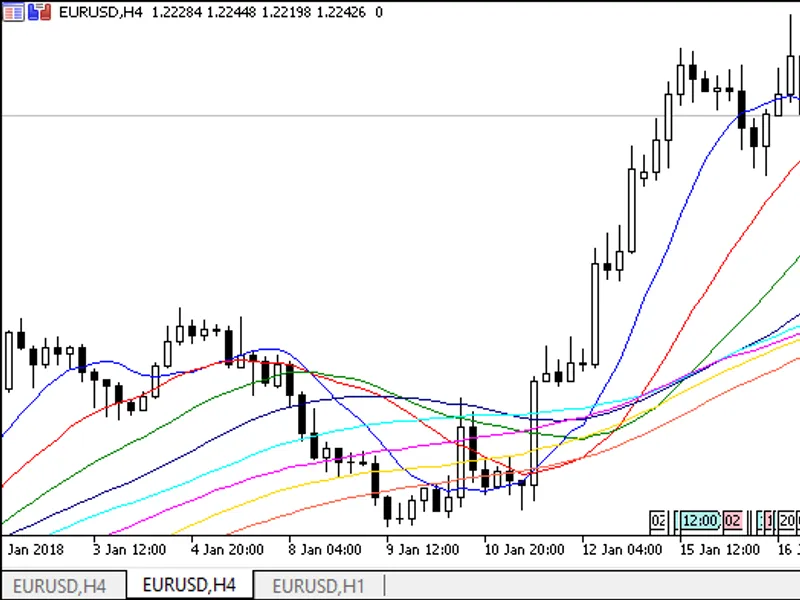
the indicator displays a set of eight moving averages. it allows setting methods and calculation prices for all mas at a time. an individual calculation period is set for each movi...
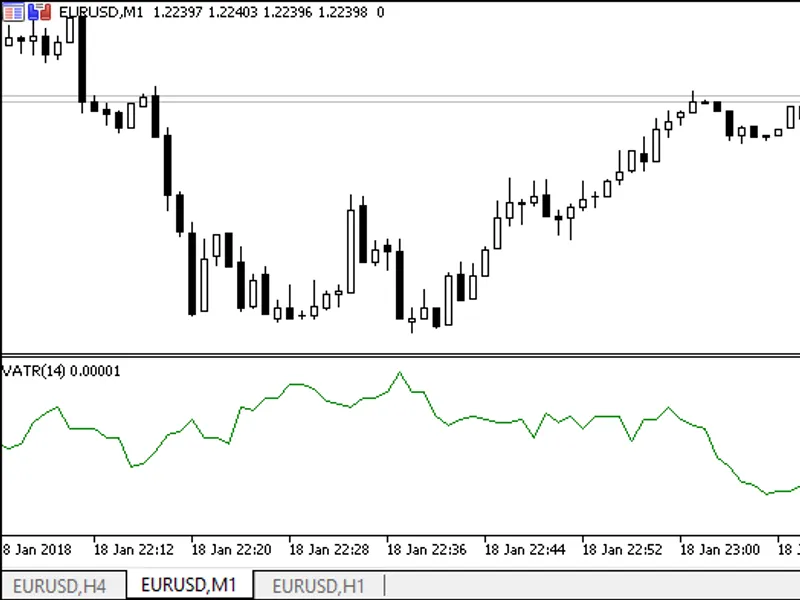
custom atr. the indicator values are calculated based on the current day's high-low and current day's high - previous day's close or current day's low - previous day's close.there ...
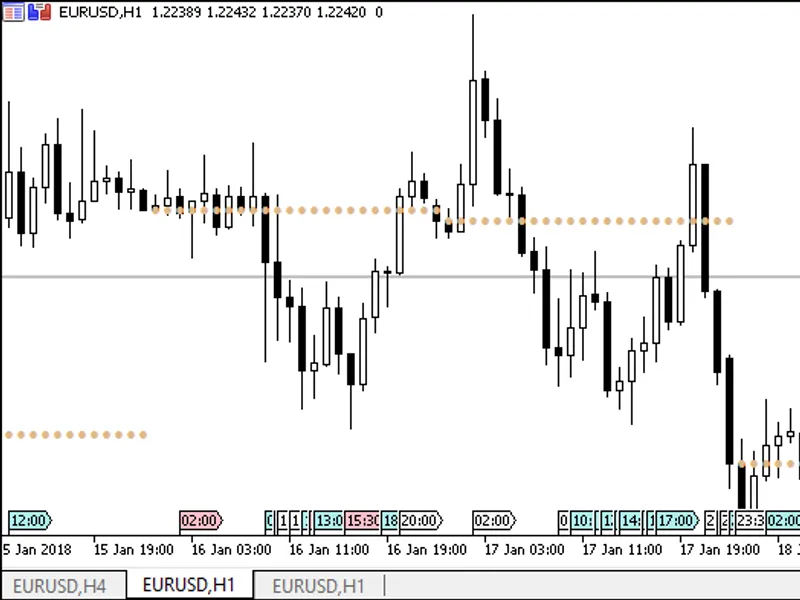
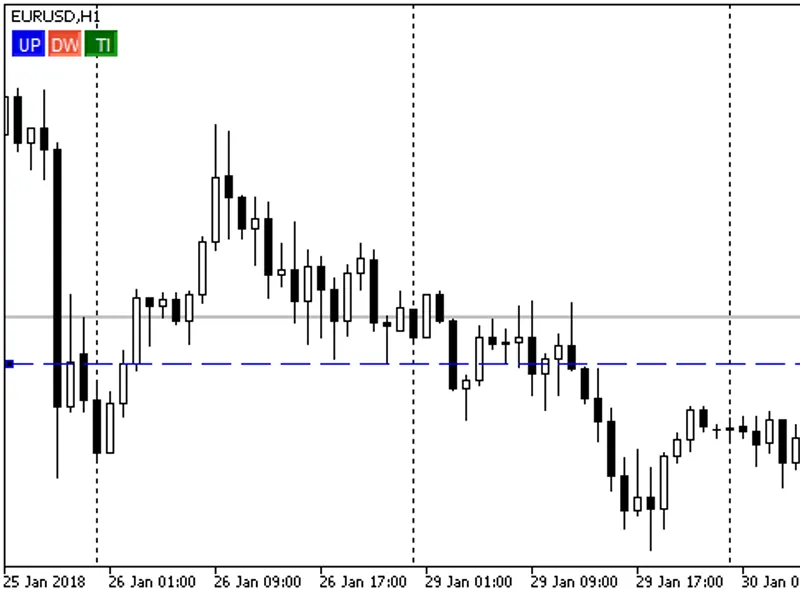
daily open line. the indicator draws a line from the beginning of the day on charts with the timeframe of h1 or below. the day beginning hour can be set in input parameters.it has ...
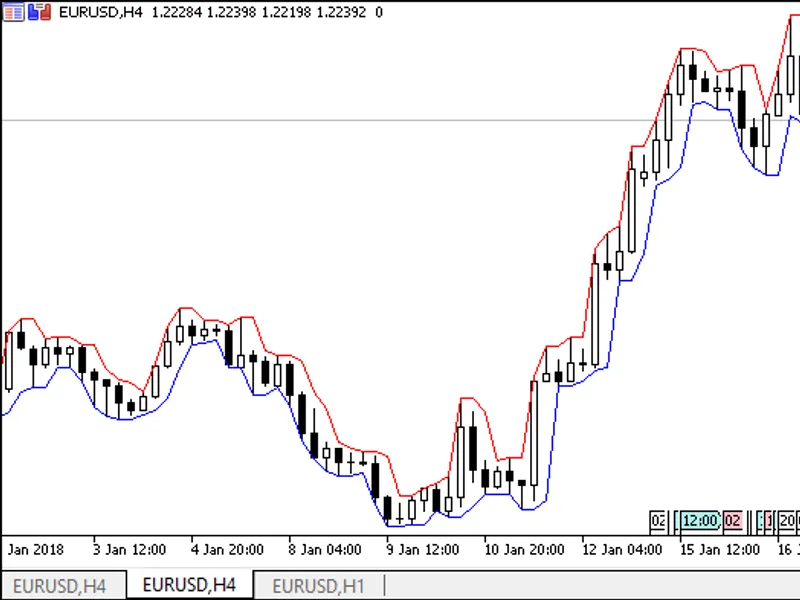
the channel is based on one of seven price types that can be selected in input parameters. if the price has moved from the previous day's value at a distance greater than the speci...
volma draws a moving average, the period of which is calculated by rsi, which is based on tick volume data.the indicator has four input parameters:rsi vol period- the period of rsi...
the channel is calculated dynamically on each bar within a day. you can enter the hour and minute for the trading day beginning.the indicator has two input parameters:hour of the b...
it is calculated as follows:the calculation is based on a moving average with a preset period, method and calculation price.the indicator has four main input parameters:period of m...
the "fractals at close prices" indicator only uses close prices in calculations. the indicator was used in the creation of the .comparison with standard fractals:gray icons show st...
the vr alert nt5 indicator warns the trader about the price reaching a specified level.the indicator has been developed as an assistant when you wait for a breakout of an important...
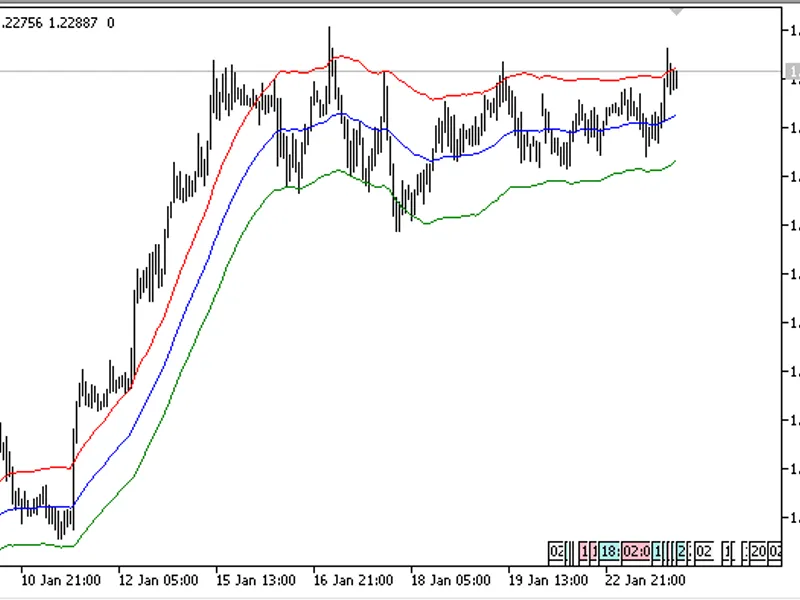
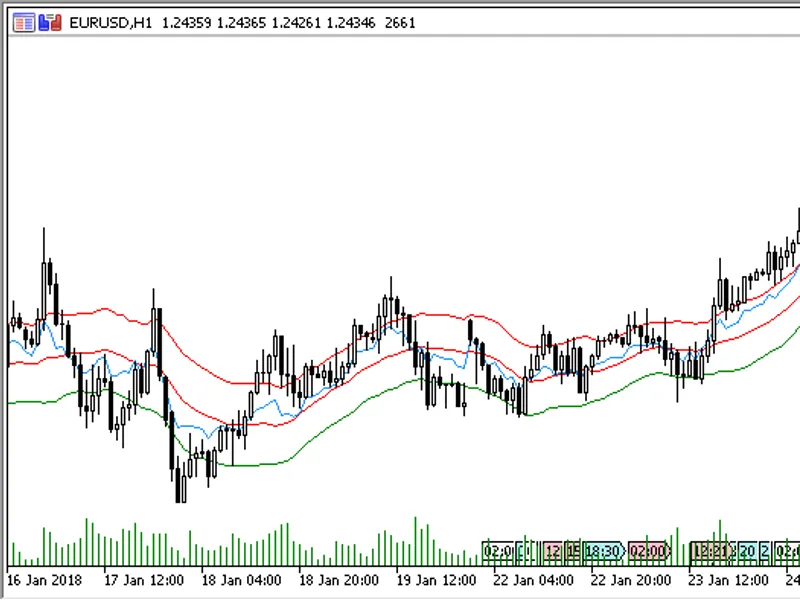
the indicator draws the keltner channel, which can be calculated using smma, ema and lwma. channel borders are calculated based on high-low or atr.smoothing periods for the central...
it allows setting any price and calculation method for the central line. the channel lines are calculated based on atr.it has five input parameters:number of the periods to smooth ...
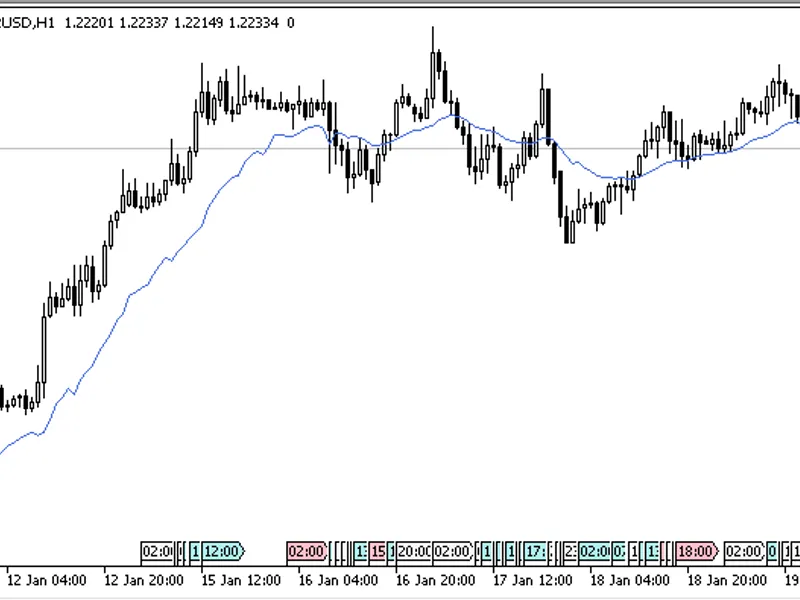
the indicator shows on one chart two simple moving averages from two timeframes: from the current one and the one specified in input parameters.it has two parameters:period ma- mov...
the indicator draws a simple moving average, which is constructed taking into account tick volumes of each bar.it has two parameters:period vama- sma calculation period;applied pri...
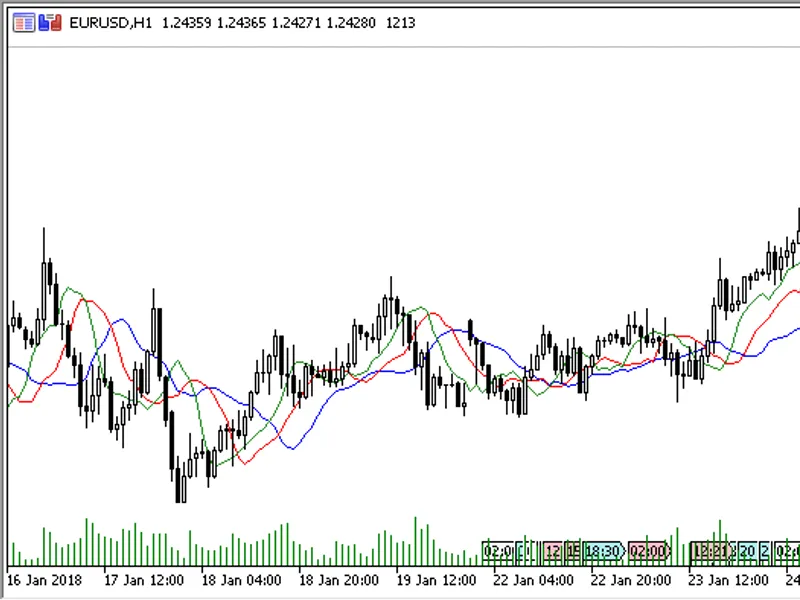
the alligator indicator based on the indicator.it has seven adjustable parameters:period of jaws line- period of alligator's jaws line;shift of jaws line- shift of alligator's jaws...
the indicator shows on a price chart the standard rsi, its overbought/oversold levels and the moving average indicator line, relative to which overbought/oversold levels are drawn....
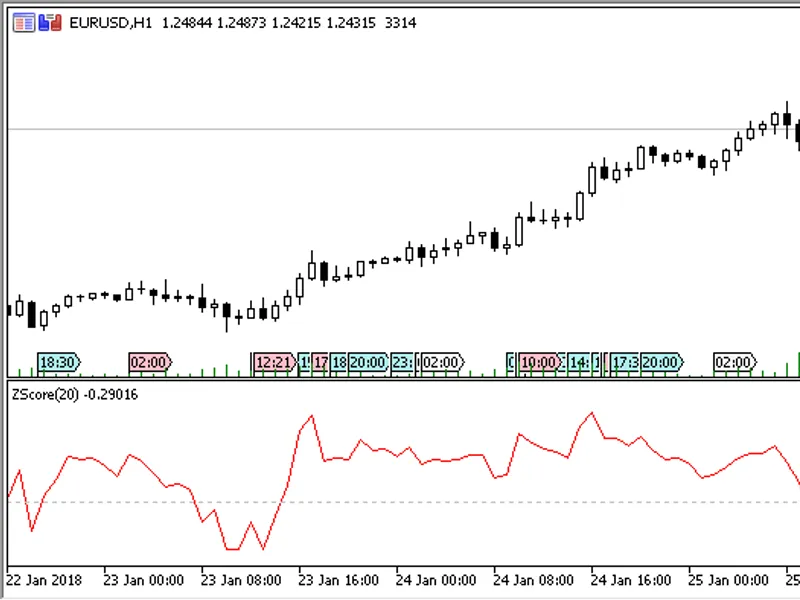
standard score(z-score) is the number of standard deviations by which the observed or measured value differs from its mean value. thus, the indicator displays the value of price de...
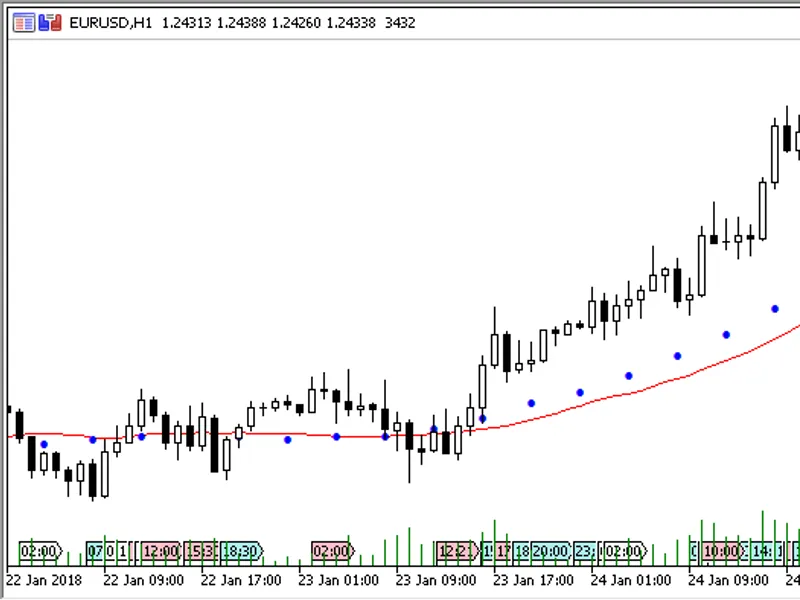
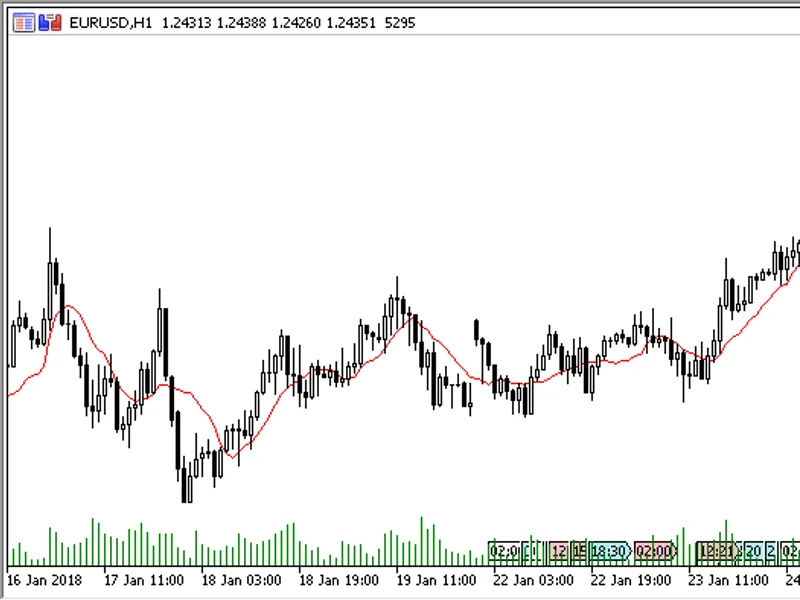
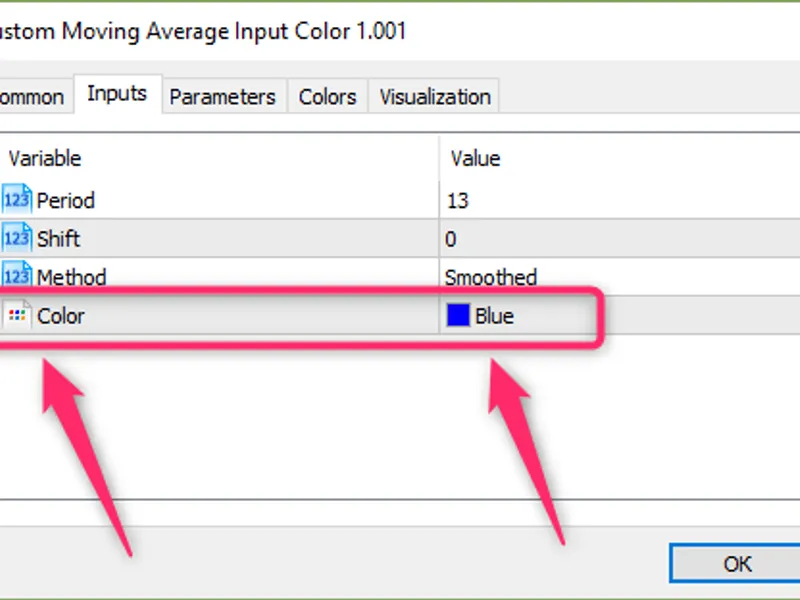
new input parameter "line color" has been added.you probably noticed that if an expert advisor uses the moving average indicator data, then this indicator is displayed only in red ...
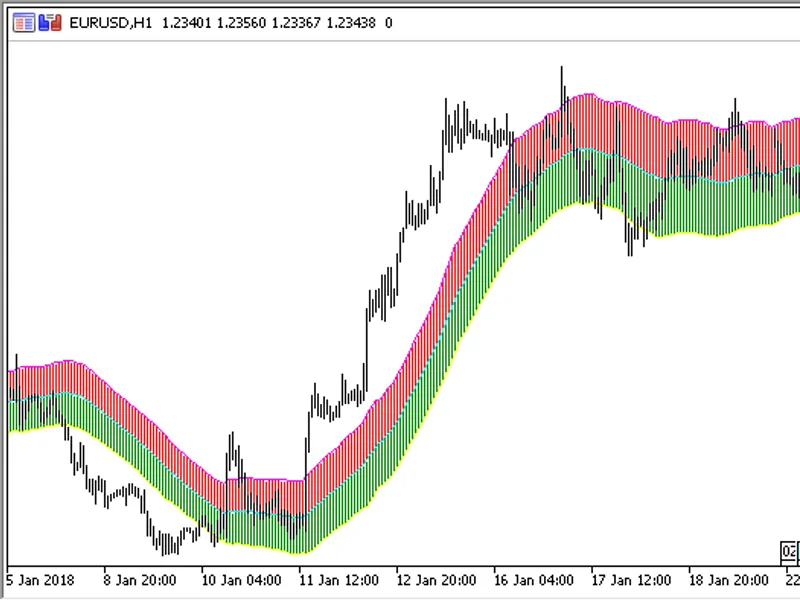
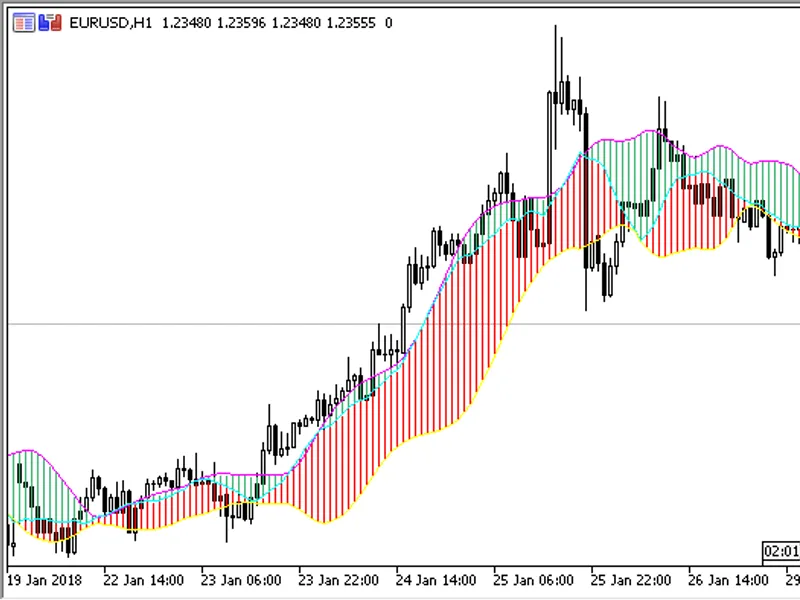
the indicator draws a moving average, as well as bullish and bearish areas built using bollinger bands calculated based on this moving average.it has five input parameters:period o...
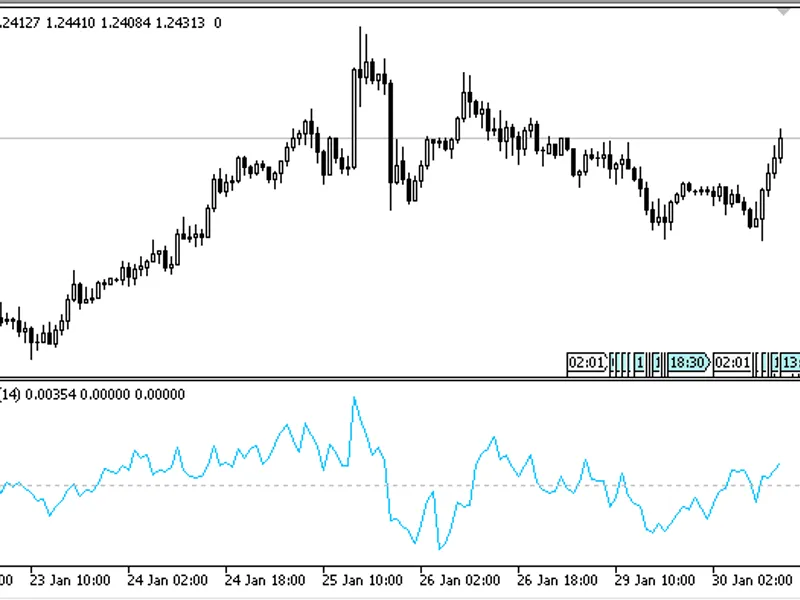
the advance trend pressure indicator shows the trend direction and strength line. it can additionally show the bullish and bearish components of the trend.trend is determined using...
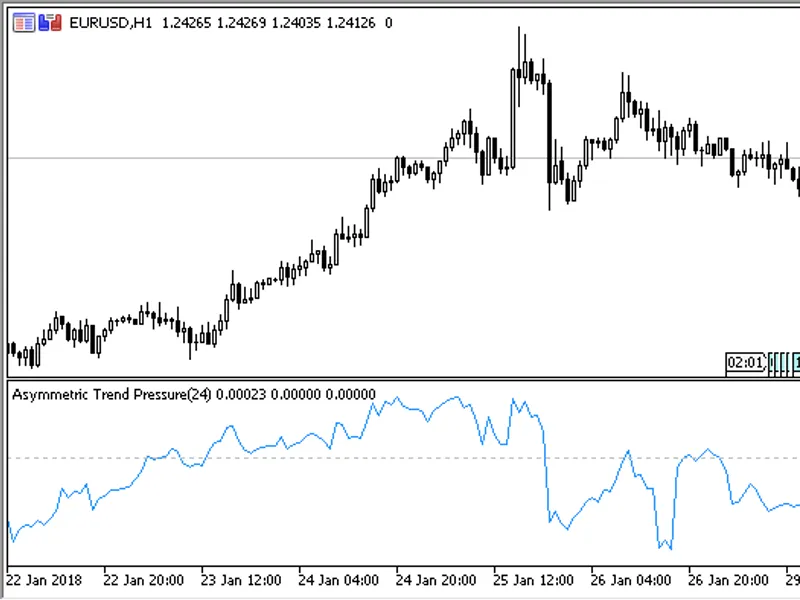
the asymmetric trend pressure indicator shows the trend direction and strength line. it can additionally show the bullish and bearish components of the trend.unlike , here only ope...
the indicator shows macd calculated based on ama.the indicator has eight configurable parameters:period of the fast ama;fast ema of the fast ama- the period of the fast ema in the ...
the channel is based on the classic rsi and displays three zones, including the overbought zone, the oversold zone and the neutral zone, which is between the overbought and oversol...
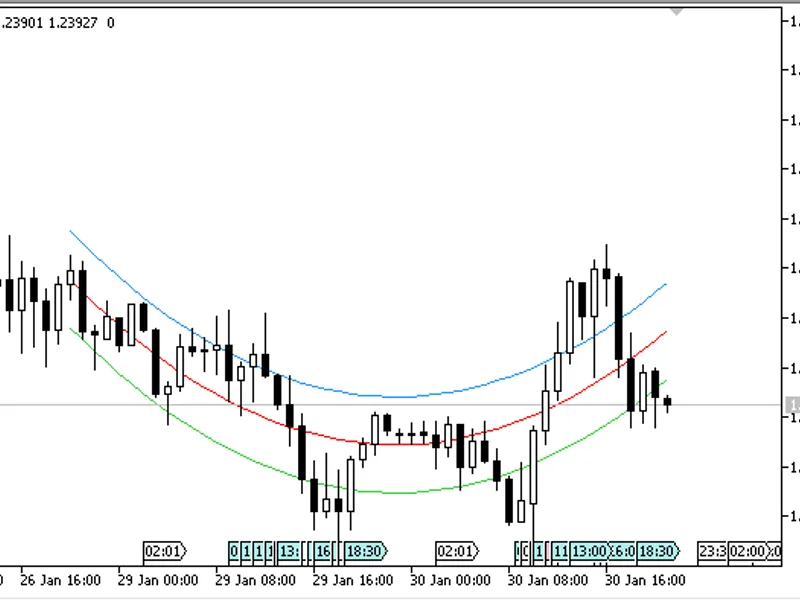
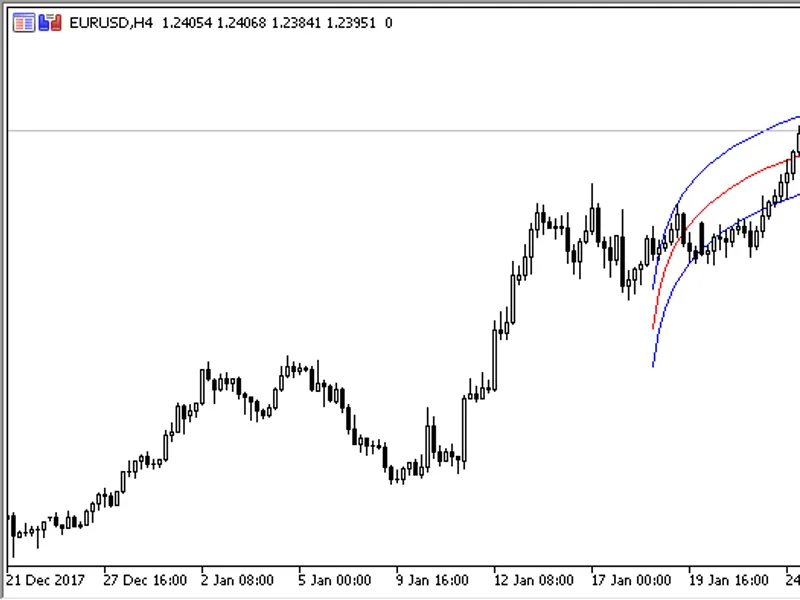
the indicator draws a channel constructed by the method of polynomial regression.it has four configurable parameters:length- the channel length in bars;power- sensitivity;deviation...
the difference indicator shows the difference between the current prices and prices as of n periods ago.it can show the difference in two modes:the difference between open and clos...
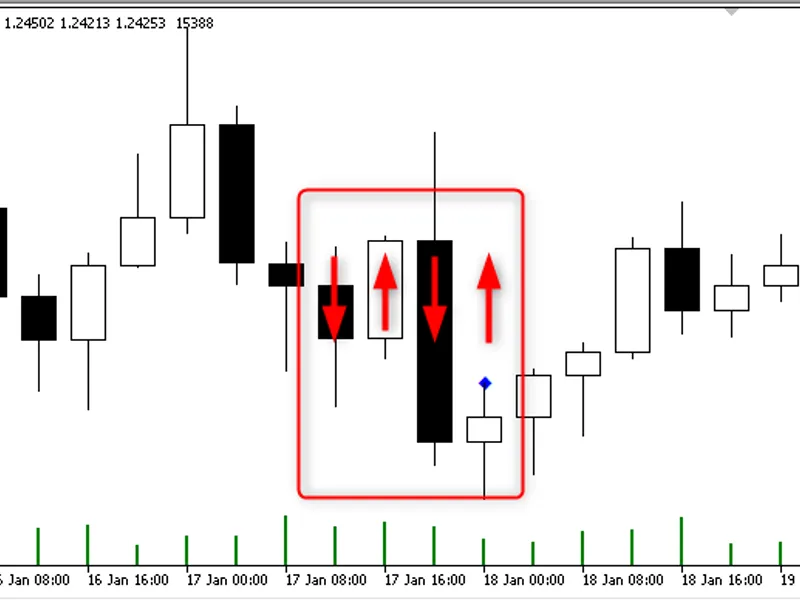
the kicking pattern indicator searches for a sequence of candlesticks on a chart and marks bullish and bearish sequences.bearish pattern: candlestick up - candlestick down - candle...
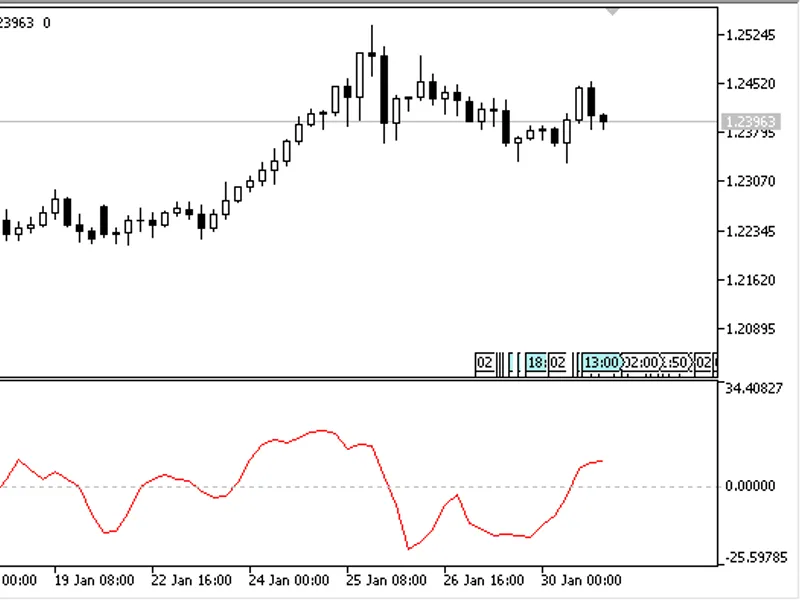
a trend oscillator. it is calculated by the following formula:sma(3) of ema (66) of ( momentum[period] - momentum[period-1] ) it has four configurable parameters:period of momentum...
the indicator draws a channel calculated by the logarithmic function.there are three adjustable parameters:length- the channel length in bars;deviation- channel width;applied price...
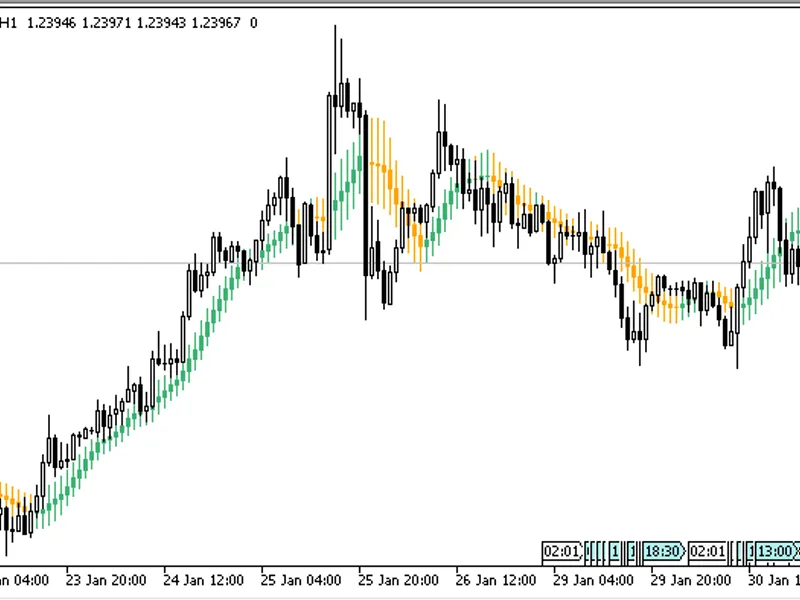
moving average candles draws a moving average as candlesticks.it has five input parameters:ma period- moving average calculation periodma method- moving average calculation method;...
median ma is a moving average, which is calculated using the median price for a given period.a sorted array of prices for the specified period is used for calculating the moving av...
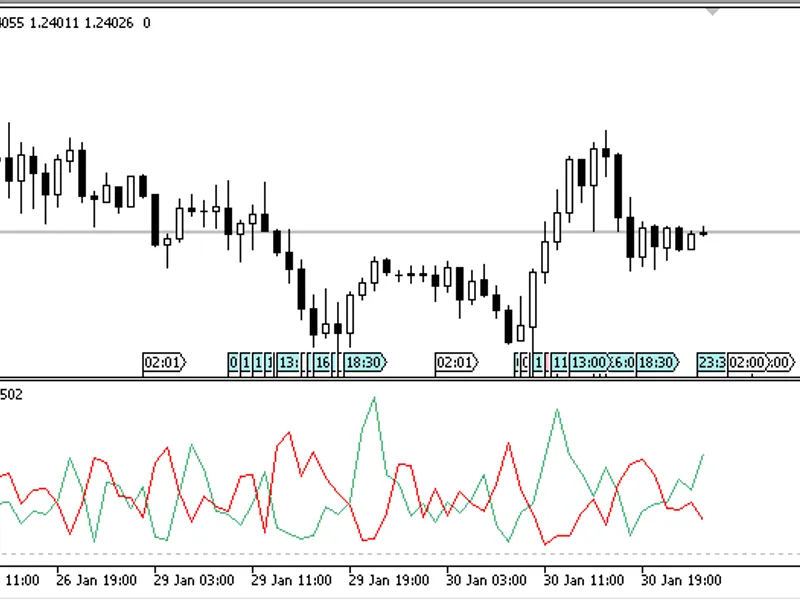
random walk index (rwi) tries to determine whether a price movement is random or it is characteristic of the price and (or) is a result of a statistically significant trend.the ind...
the indicator draws a moving average calculated by the square weighted (sqwma) methodit has two parameters:period- calculation period;applied price- price used for calculations. ...
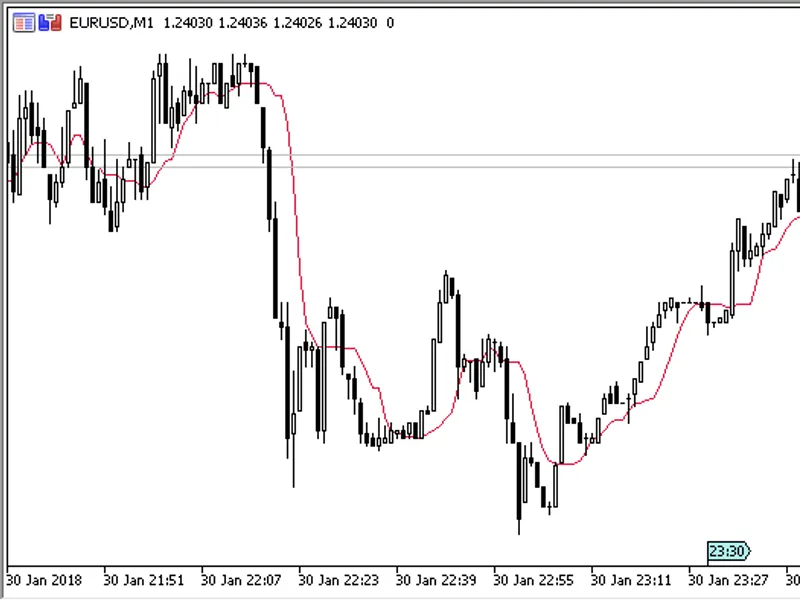
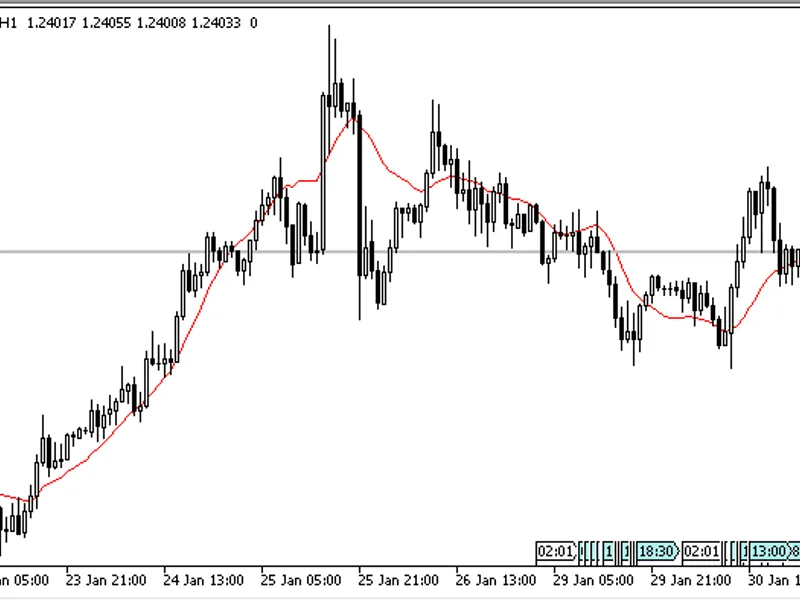
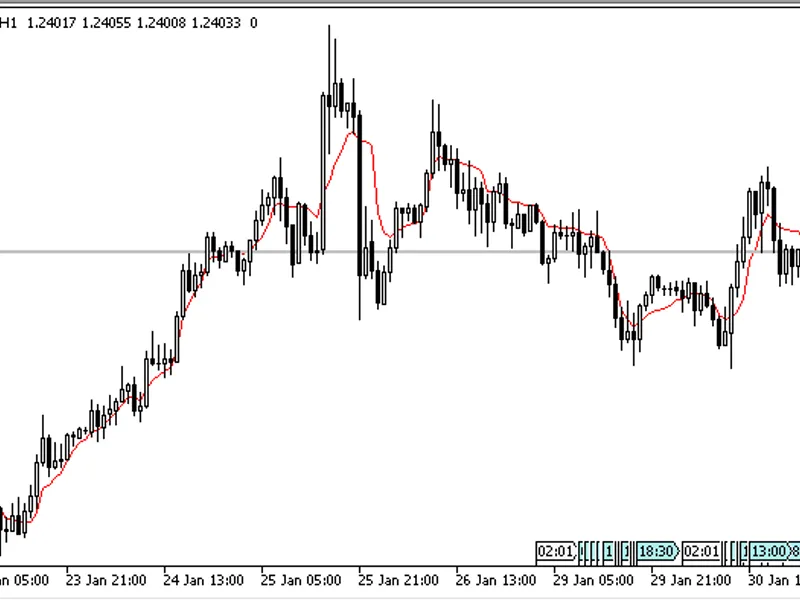
the vma indicator draws a moving average, the period of which changes dynamically depending on volatility. the higher the volatility, the greater the period of the moving average, ...
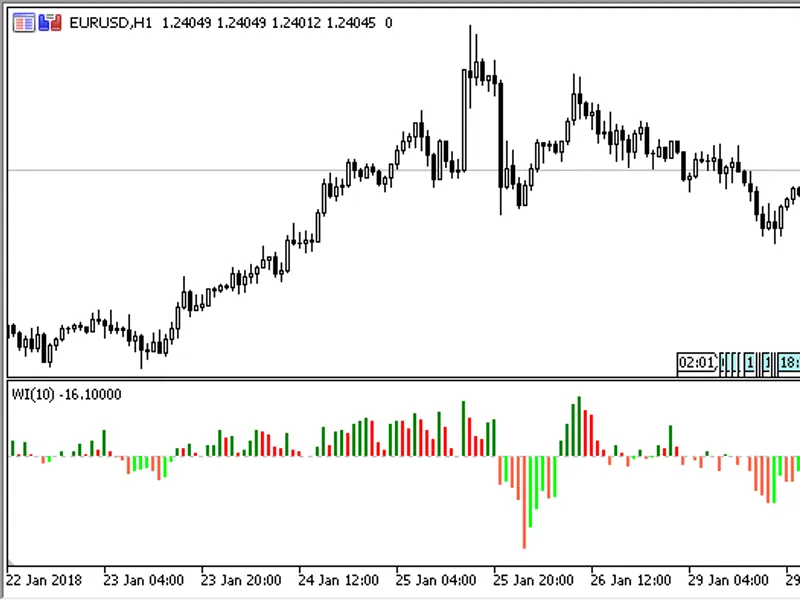
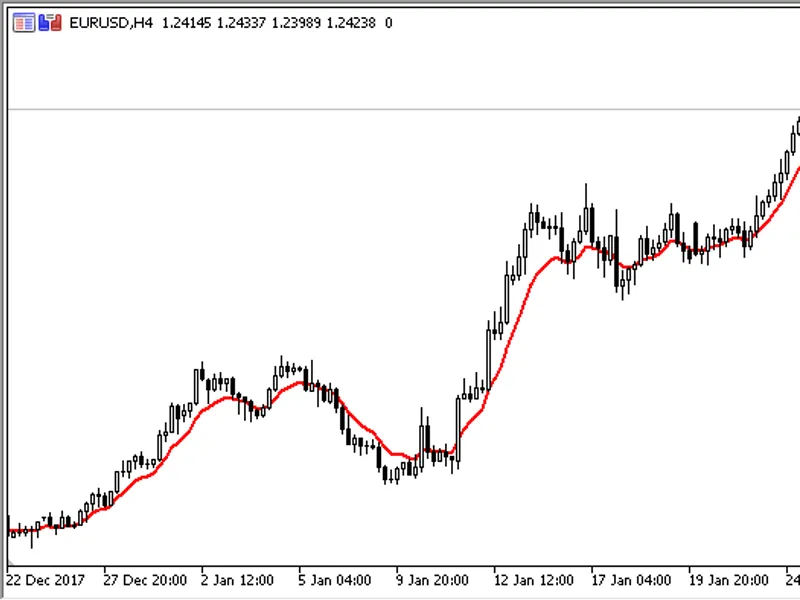
the wi indicator shows a moving average calculated by the following formula:wi(2 * close-high-low) it has two parameters:period- calculation period;method- calculation method. ...
zero lag is a modified ema.calculation formula:the formula is similar to ema with an addition of a new value gain * (close - zl [1])gainis the value selected from the interval [-ga...
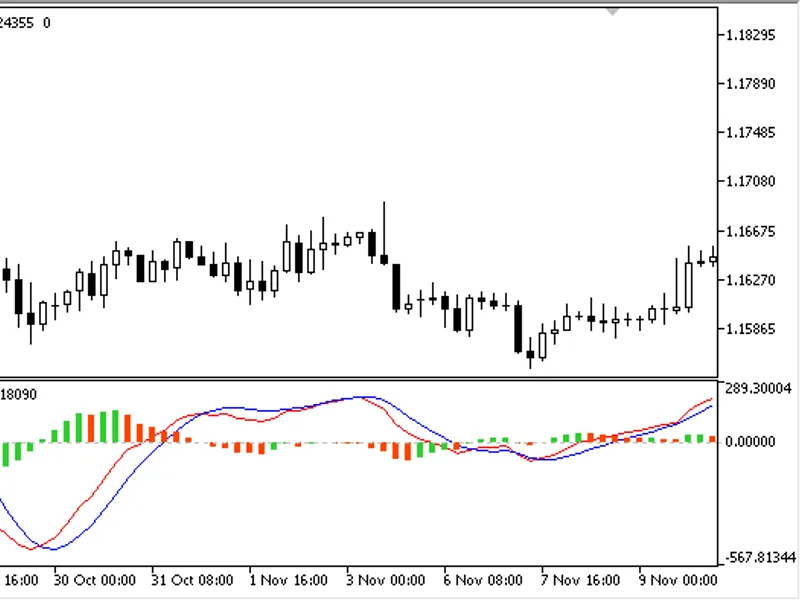
unlike the standard macd, the indicator has a smaller lag and three lines:the macd line; a signal line; histogram. the histogram can serve as a leading signal - the histogram color...
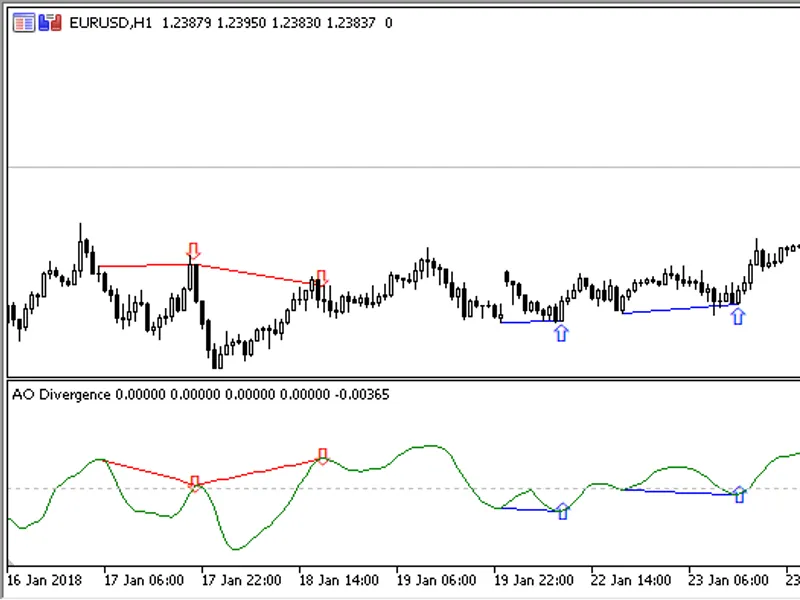
the custom indicator ao_divergence draws the ao indicator line in a separate window and displays found divergences in the indicator window and on the price chart.unlike the standar...
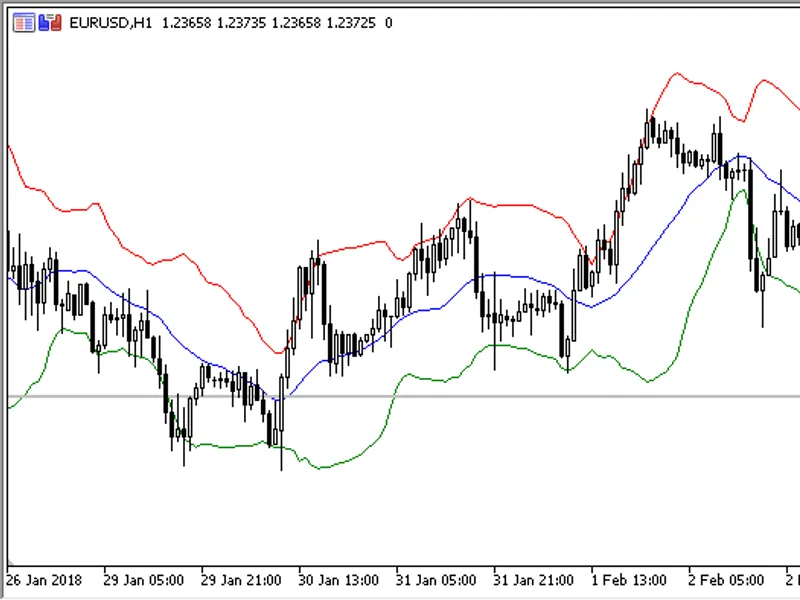
common bollinger bands with the possibility to set the colors and styles of all lines.there are three adjustable parameters:period - perioddeviation - deviationapplied price- calcu...
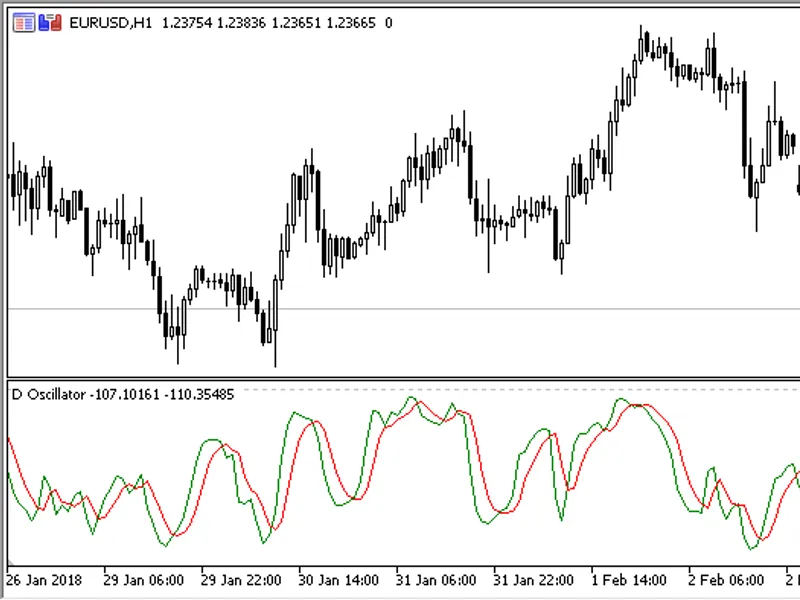
d-oscillator is an oscillator based on the rsi and cci ratio.calculation formula wheremaxrsi, minrsi - the maximum/minimum values of rsi between [i-d_period] and [i].the indicator ...
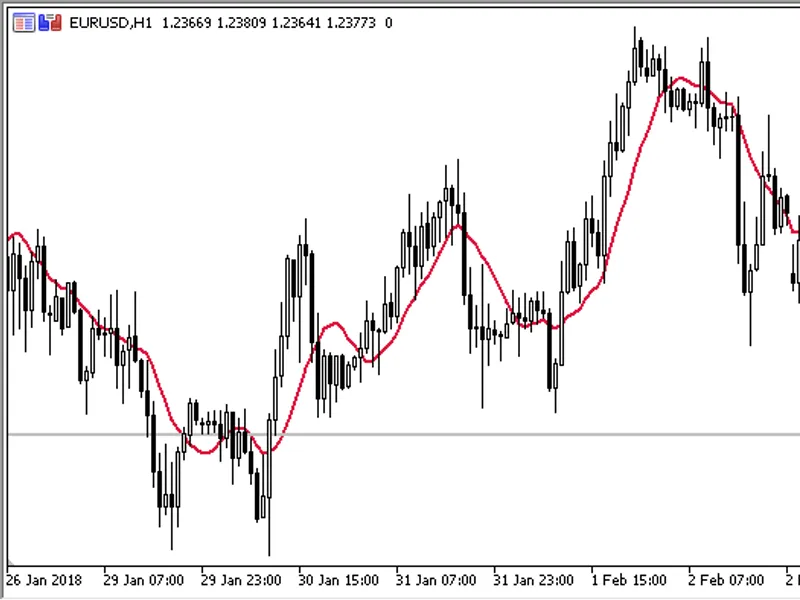
a simple moving average calculated by the geometric mean method.the indicator has two input parameters:period- calculation period;applied price- price used for calculations. ...
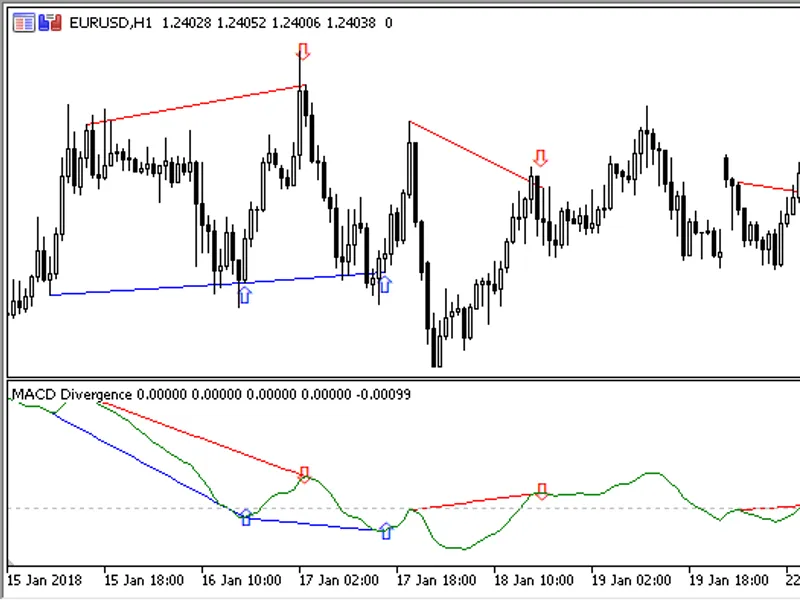
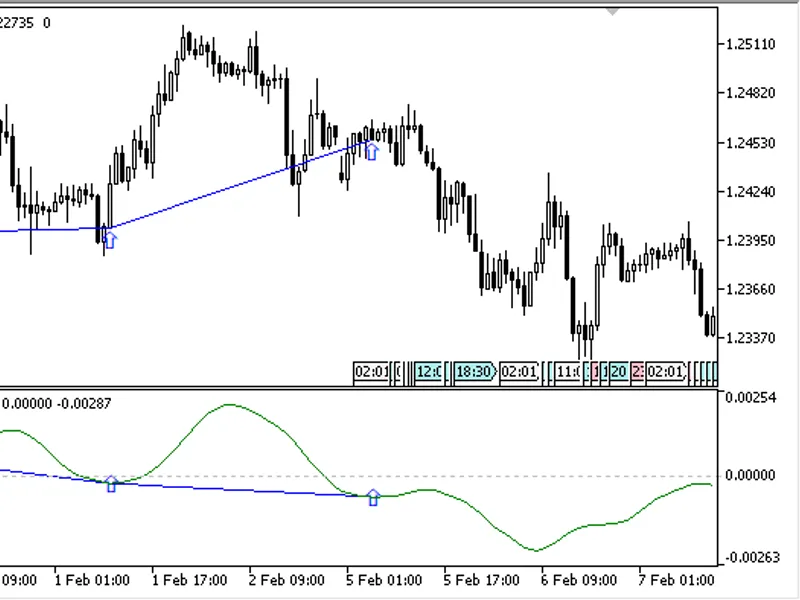
the custom macd_divergence indicator draws the macd indicator line in a separate window and displays found divergences in the indicator window and on the price chart.unlike the sta...
the custom macd_signal_divergence indicator draws a signal line of the macd indicator in a separate window and displays found divergences in the indicator window and on the price c...
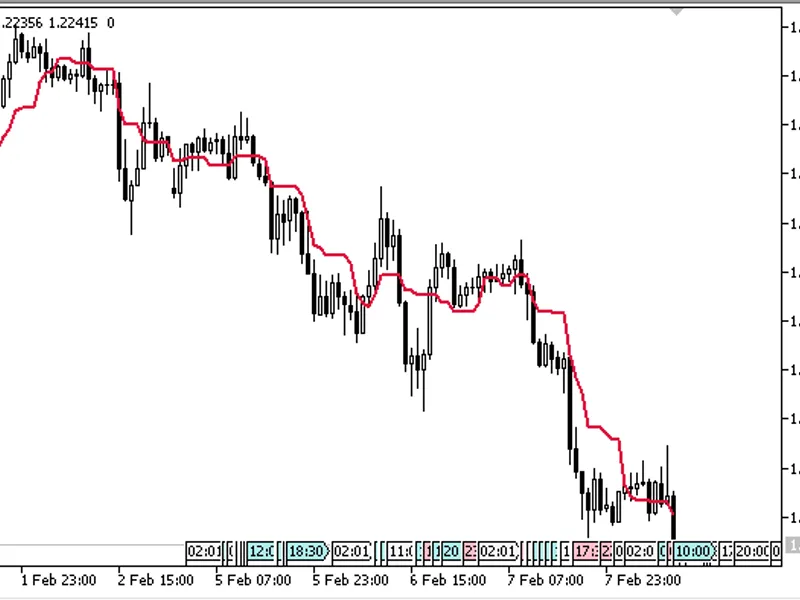
the indicator draws a moving average line calculated based in the low and high prices over the given interval of bars.calculation formula minmaxma[i] = (min + max)/2 where min, max...