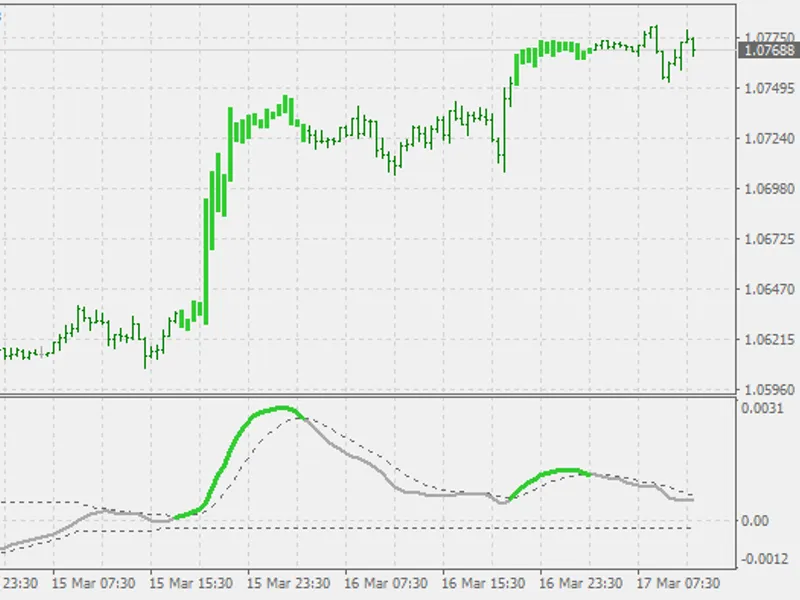
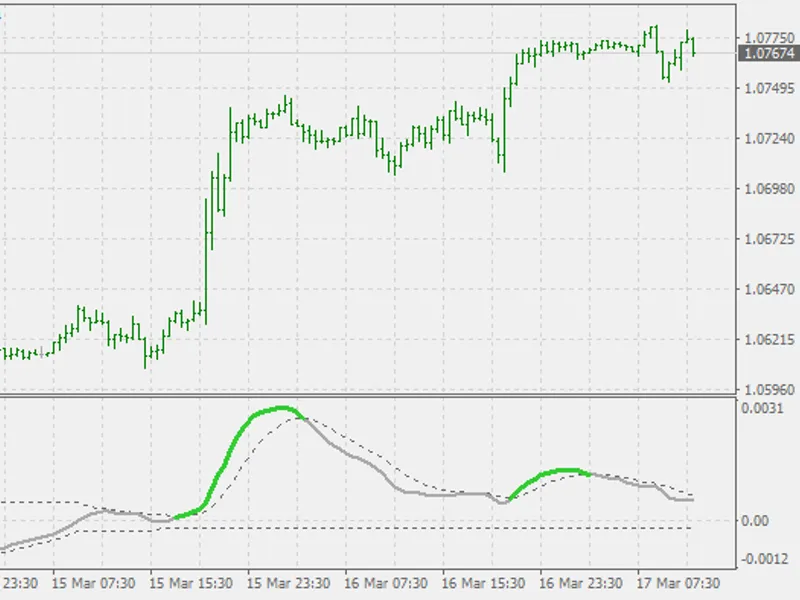
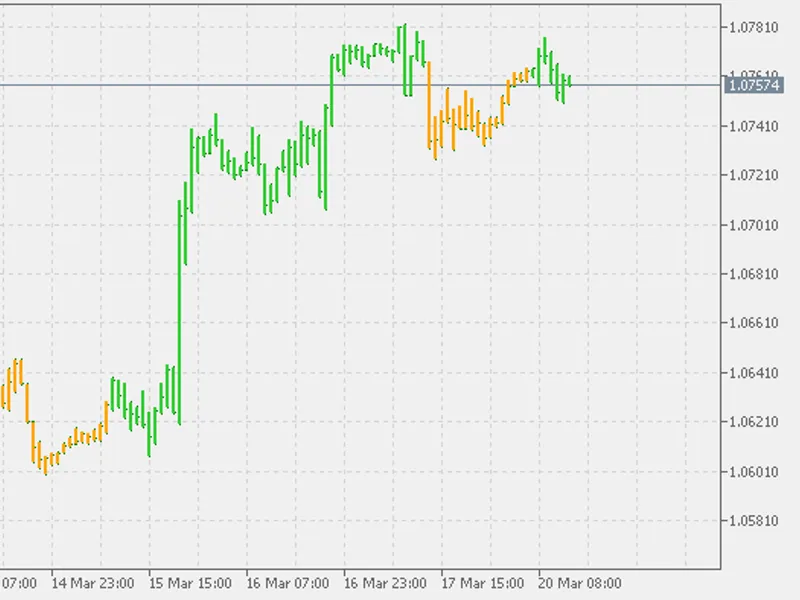
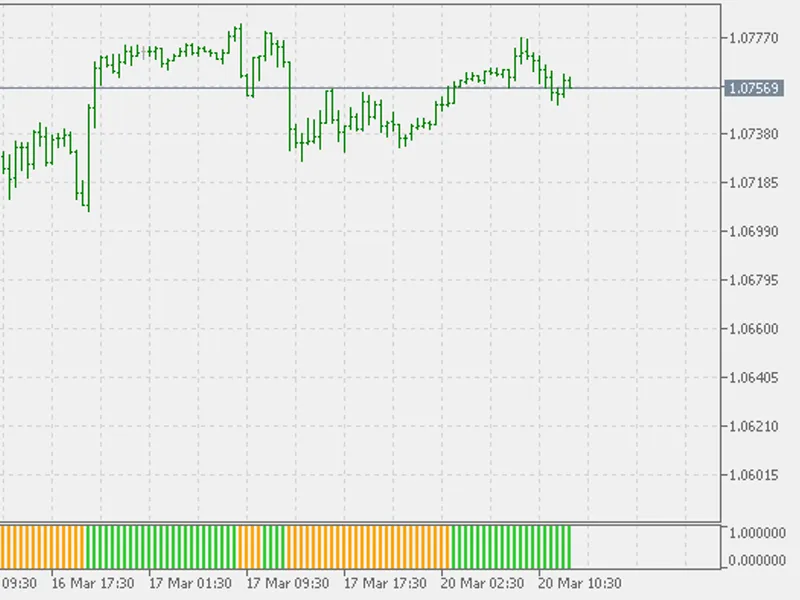
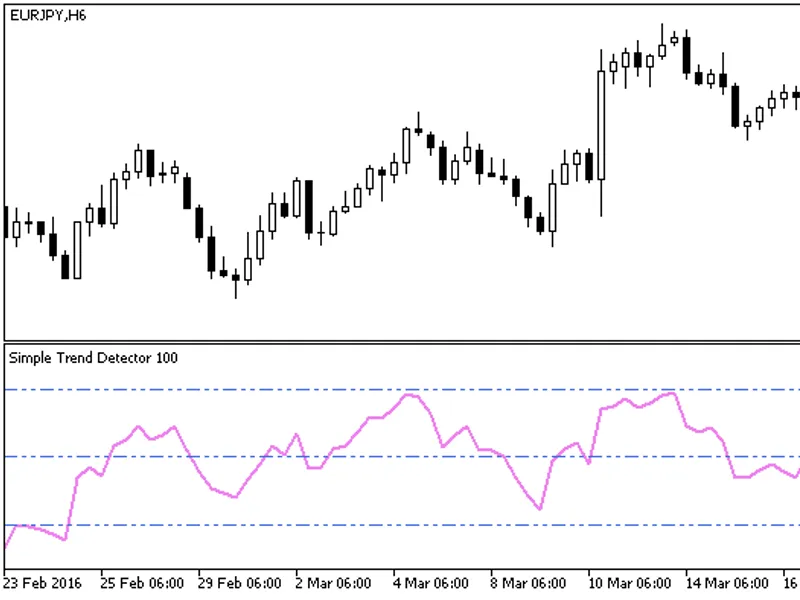
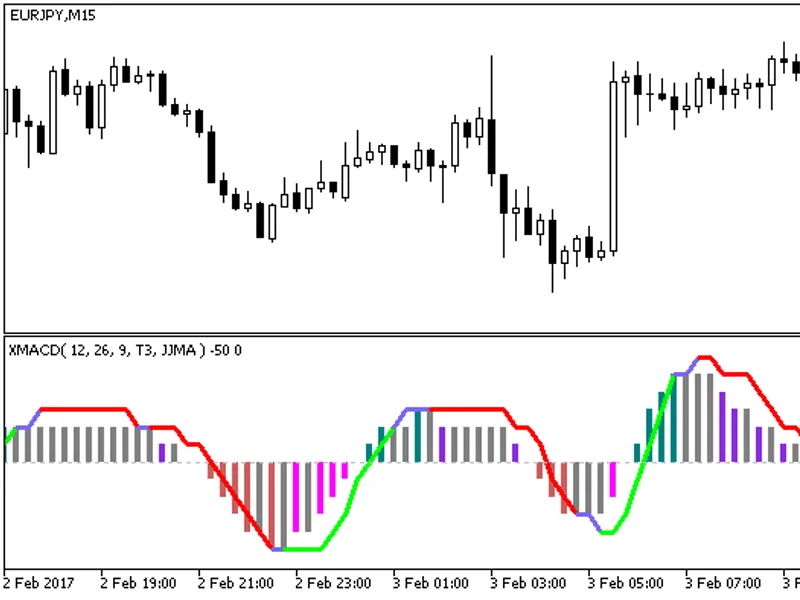
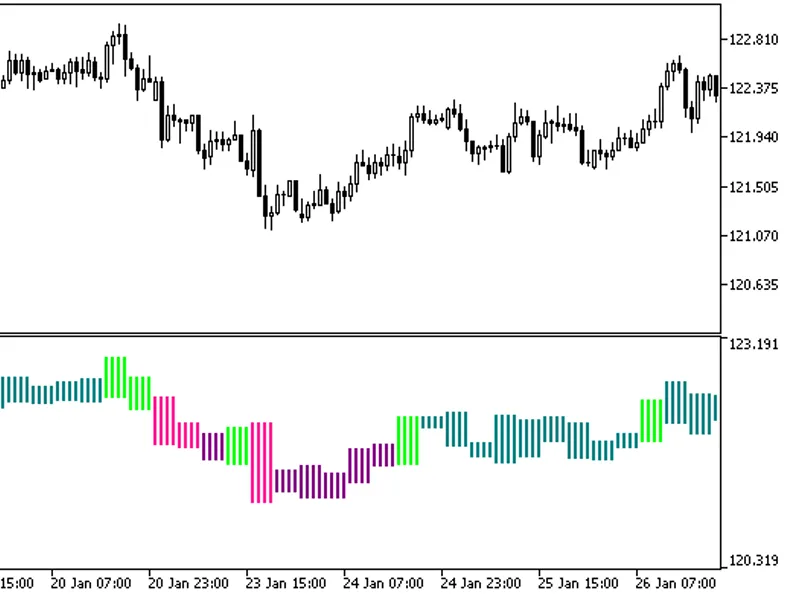
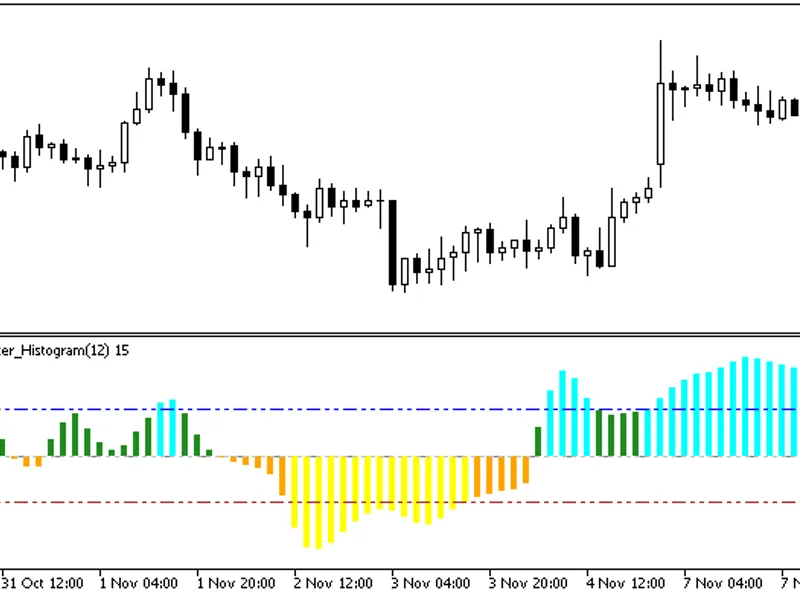
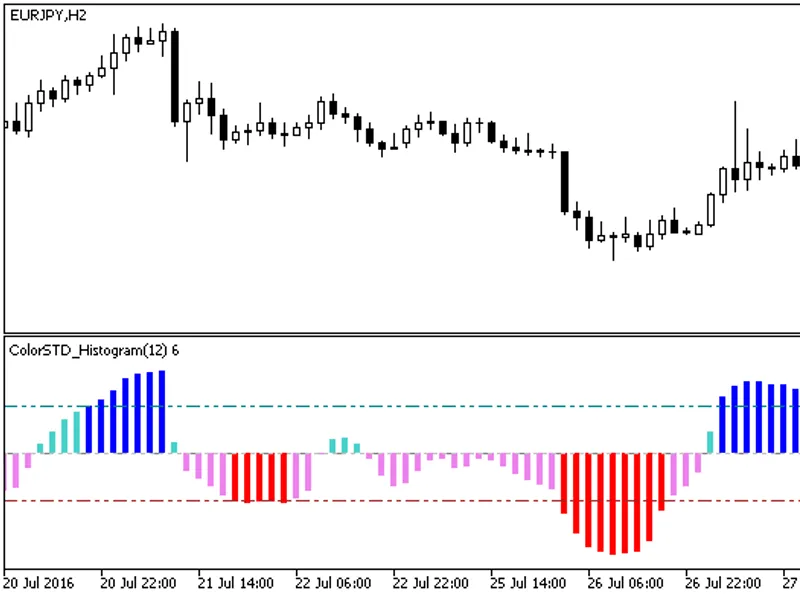
This indicator identifies currencies present in the chart and compares their current closing values across all currency pairs. The objective is to determine whether a currency is s...
The AD XM indicator utilizes VHF Adaptive principles. For optimal observation of its adaptive behavior, longer timeframes are recommended. Shorter timeframes offer minimal adaptive...
DMI Short Description (as it is not widely known).As with all DSL indicators, it can be used in both trend and counter-trend trading.Additionally, the DSL in this indicator can con...
DMI Oscillator, a version of the Discontinued Signal Lines (DSL) family of indicators.The Directional Movement Index (DMI) is used here to enhance the oscillator's capabilities.Sim...
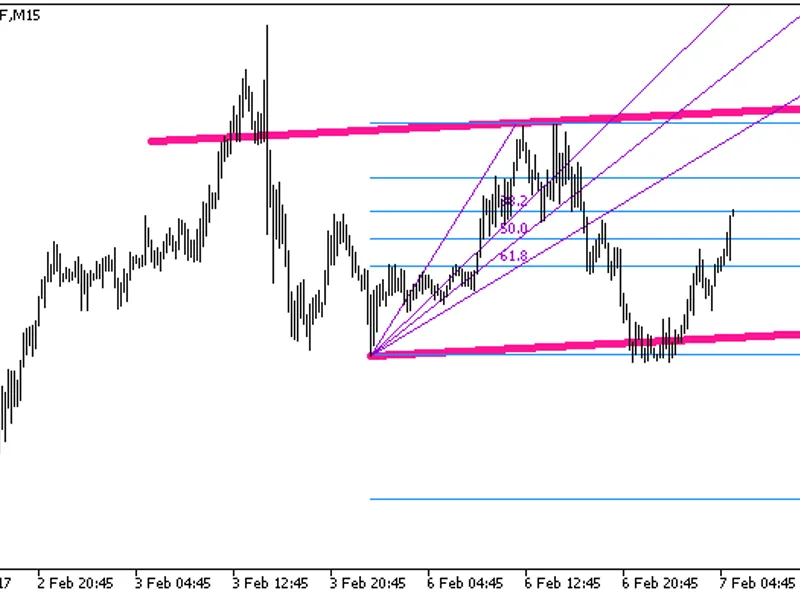
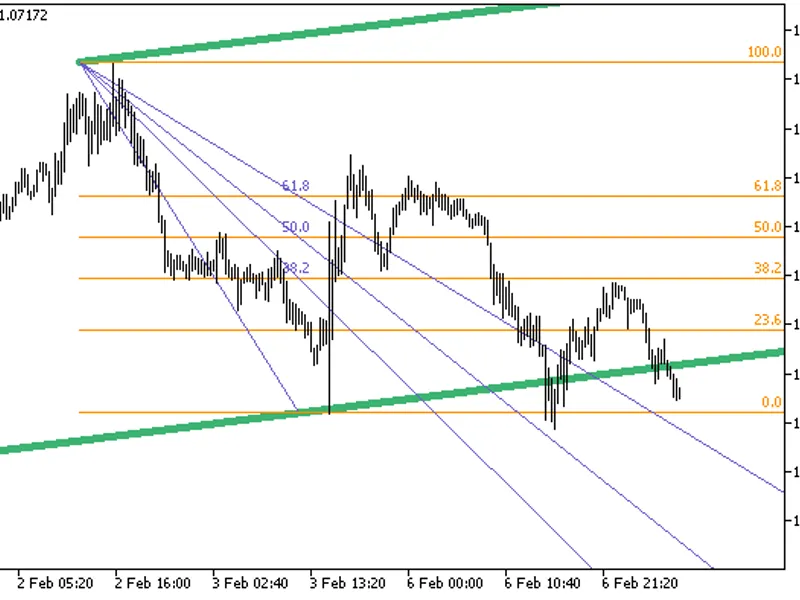
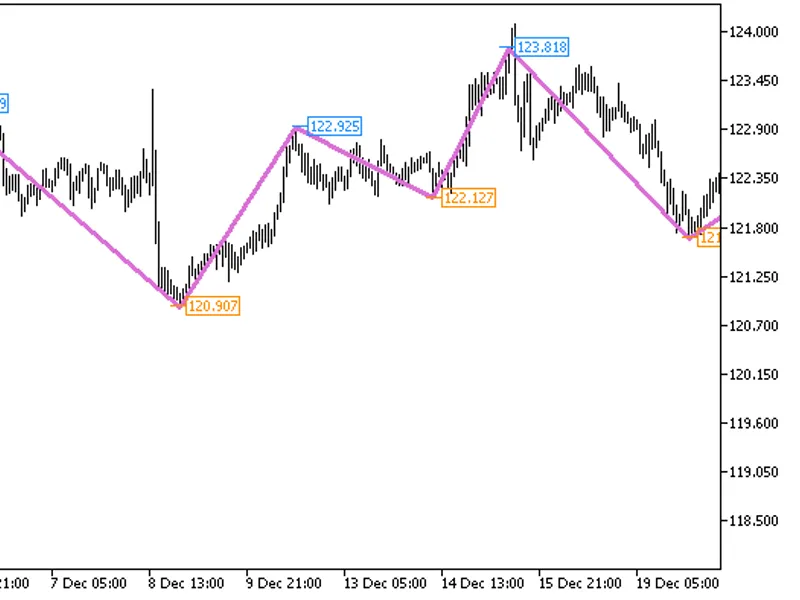
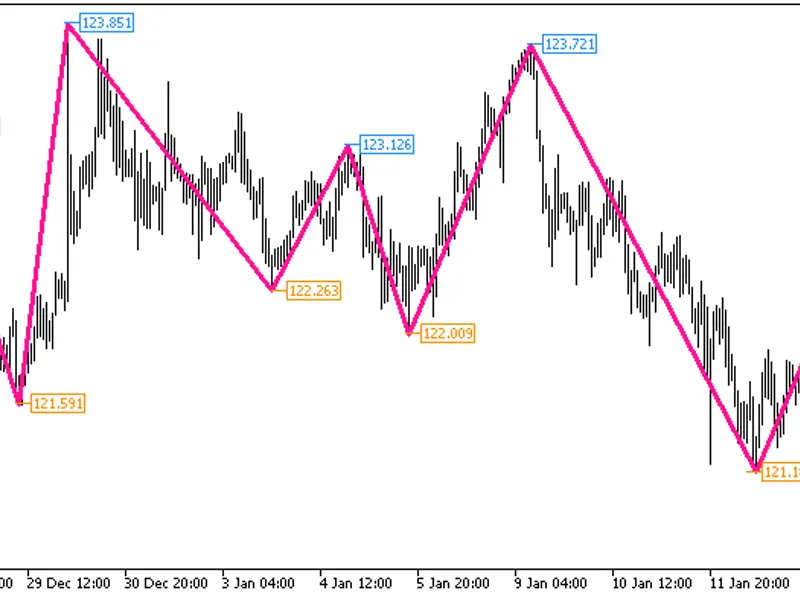
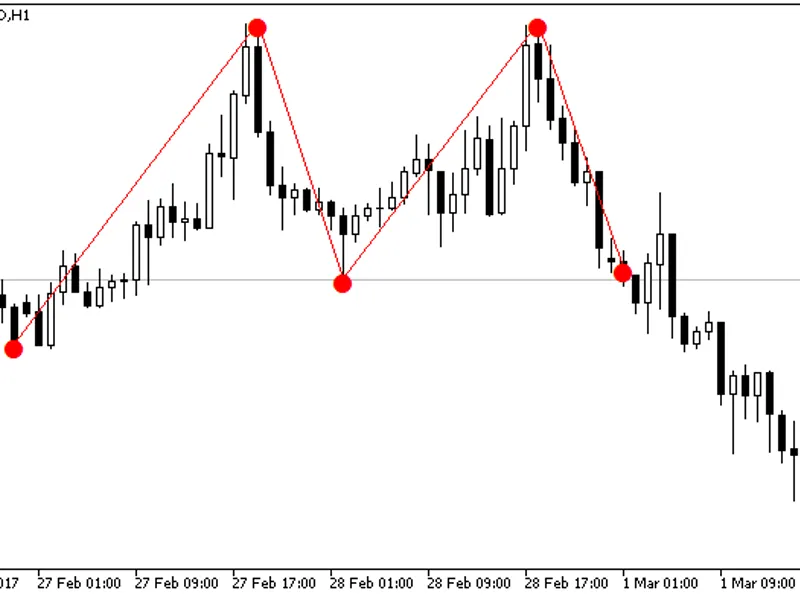
This indicator displays Zig Zag lines to help identify market cycles.It also draws Fibonacci lines to indicate potential support and resistance levels.The code has been optimized t...
Ultra-AT-R Scalping Tool: An Advanced Indicator for Precise TradingThis indicator was initially developed as a personal reference tool, functioning akin to a rifle scope for identi...
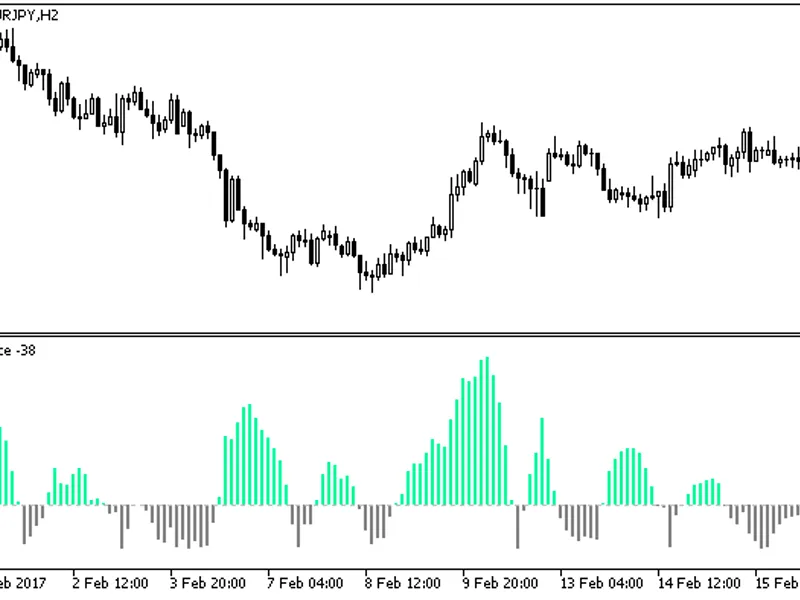
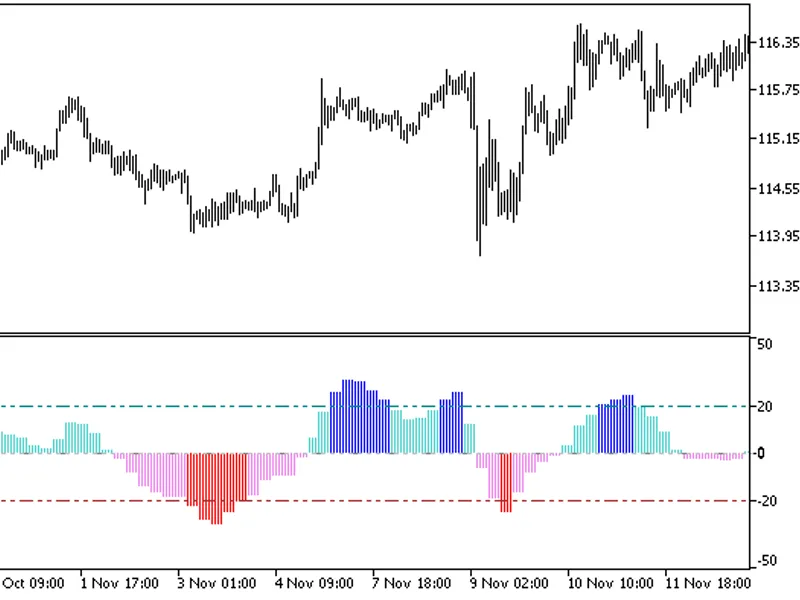
The Detrended Synthetic Price indicator is a technical analysis tool.It is designed to identify price trends and cycles.Usage Notes:The indicator can be applied in various ways. On...
The Detrended Synthetic Price indicator was originally developed by John Ehlers. While there are multiple methods for its application, the approach involving fixed levels, which is...
The Detrended Synthetic Price Oscillator was originally developed by John Ehlers. There are various ways of using it, but the method involving fixed levels is limited, requiring ma...
The Detrended Synthetic Price indicator was originally developed by John Ehlers. There are various ways of using it, but the method using fixed levels is very limited in its usage,...
The Detrended Synthetic Price indicator is a tool for technical analysis.This indicator was developed by John Ehlers.While there are multiple methods for its application, a common ...
Detrended Synthetic Price Oscillator was originally developed by John Ehlers.There are various ways of using it, but the one found to be used mostly (with fixed levels) is very lim...
Precision Trend Indicator (Histogram) - A MetaTrader 4/5 UtilityThis indicator, named 'Precision Trend Indicator (Histogram)', is developed to assist traders by offering dependable...
Precision Trend Indicator (Histogram) is a specialized tool designed to assist traders within the MetaTrader platform.This indicator adheres to standard MT4/MT5 practices, ensuring...
This indicator plots price channels and Fibonacci levels based on recent peaks.Indicator Input ParametersThe indicator requires the compiled nrtr_zigzag.mq5 indicator file. Please ...
This indicator displays price channels and Fibonacci levels derived from recent price peaks.Input ParametersTo use this indicator, you must first have the nrtr_extr_zigzag.mq5 indi...
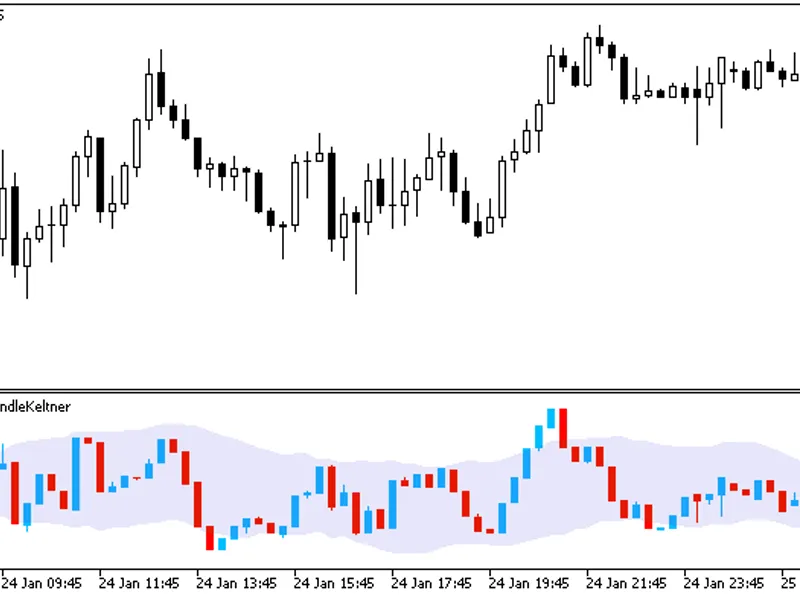
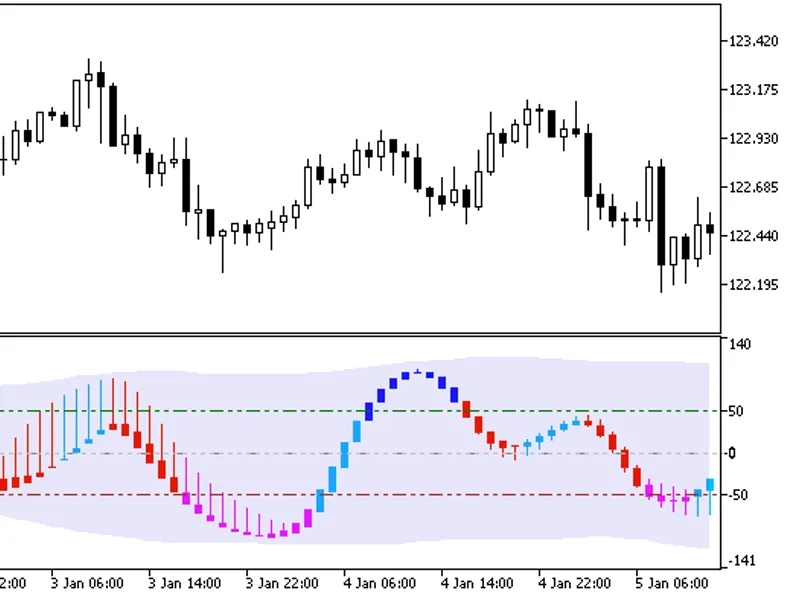
The Keltner Channel indicator is built relative to the average value of the oscillator, presented as a sequence of candlesticks.Figure 1: The Momentum Candle Keltner Indicator....
The OS MA Candle Keltner indicator displays Keltner Channels built relative to the average value of an oscillator, presented as a sequence of candlesticks.Figure 1. The OSMA Candle...
A straightforward oscillator that calculates the difference between candlestick open and close prices.
This indicator shares similarities with RSI and DeMarker but offers increased...
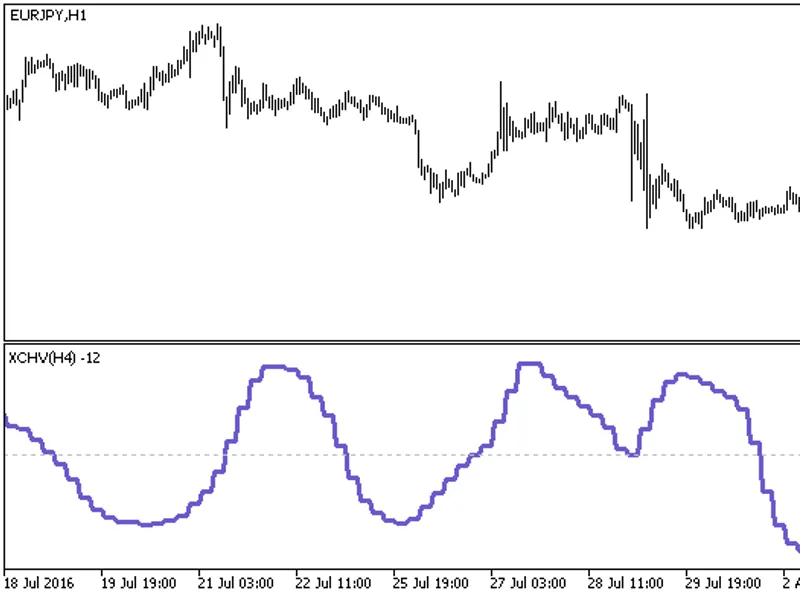
Chaikin Smoothed Volatility Indicator with Timeframe Selection OptionThis indicator includes a timeframe selection option available in the input parameters.To ensure correct operat...
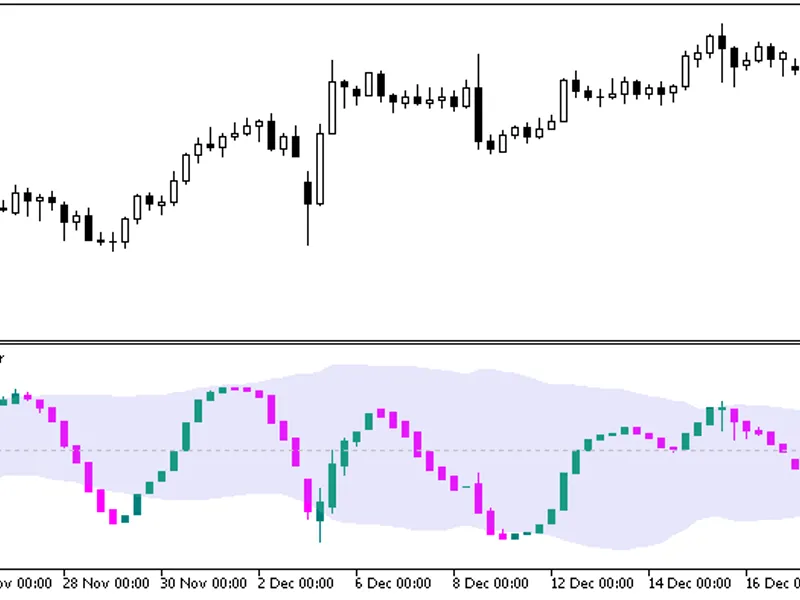
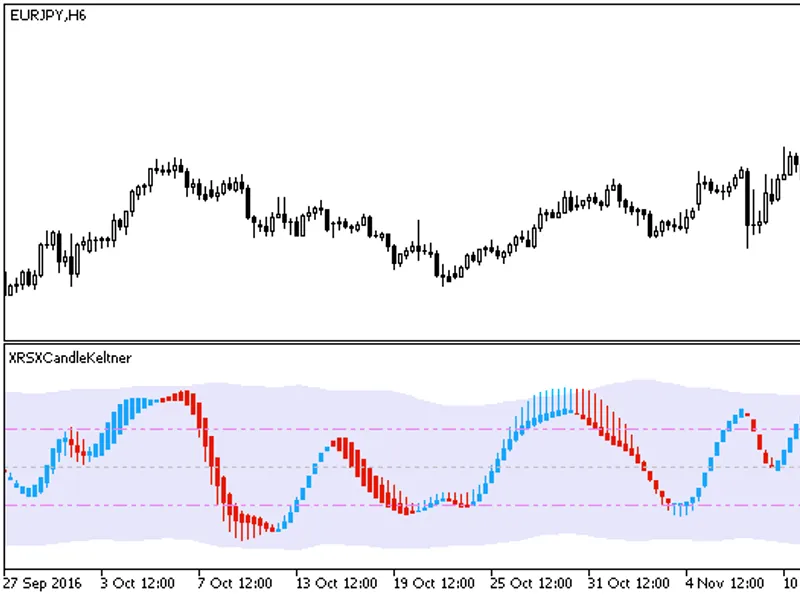
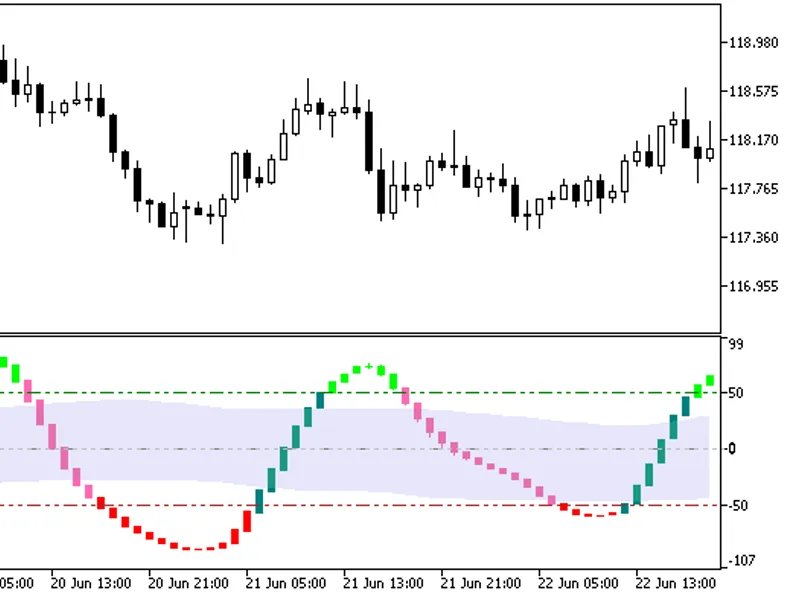
The XR S X Candle Keltner indicator displays Keltner Channels relative to the average value of an oscillator, represented as a sequence of candlesticks.
This indicator utilizes cla...
NRTR Zig Zag Price HTF Indicator with Timeframe SelectionThis indicator includes an option for timeframe selection directly within the input parameters.For the indicator to functio...
NRTR Extr Zig Zag Price HTF Indicator with Timeframe Selection.This indicator includes a timeframe selection option in its input parameters.To ensure correct operation, place the c...
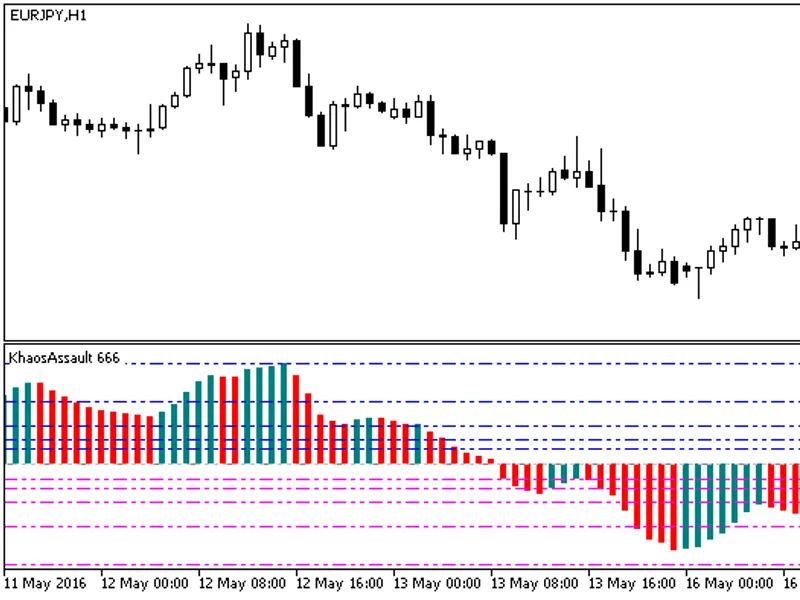
The Khaos Assault indicator was initially developed for MQL4 and released on September 18, 2026.This indicator utilizes the smoothalgorithms.mqh library classes. Please ensure thes...
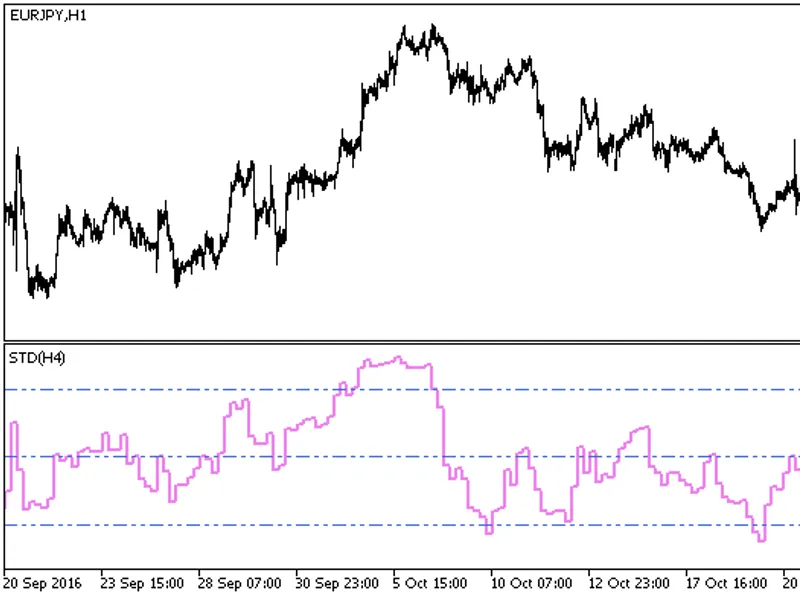
STD HTF Indicator with Timeframe SelectionThe STD HTF indicator includes a timeframe selection option within its input parameters.To ensure correct functionality, please place the ...
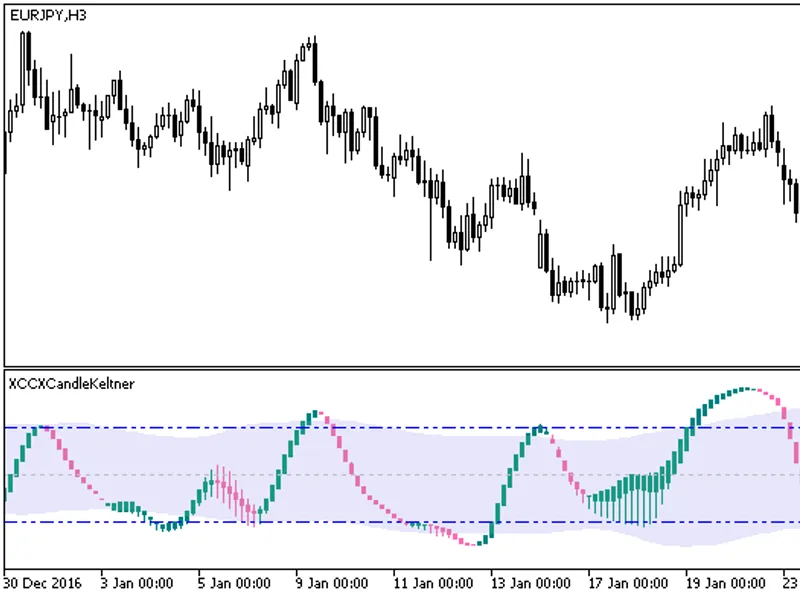
The XCCX Candle Keltner indicator builds Keltner Channels relative to the average value of an oscillator, presented as a sequence of candlesticks.This indicator utilizes classes fr...
XR S X Candle Keltner Plus Indicator with Breakout OptionThis indicator offers a breakout indication option, with two variants for color indication:- Breakout of overbought/oversol...
The XC Candle Keltner Plus indicator provides breakout indications based on the selected input parameter mode. There are two methods for displaying these breakout alerts:
- Breako...
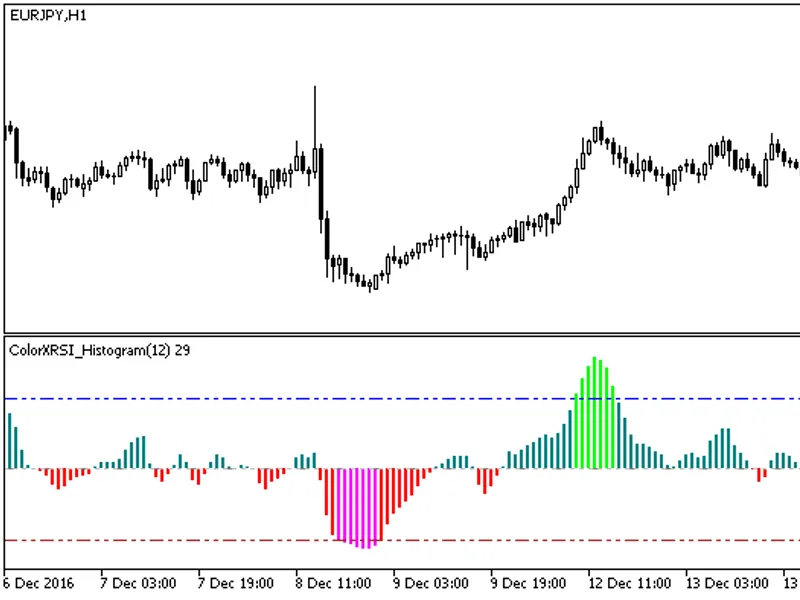
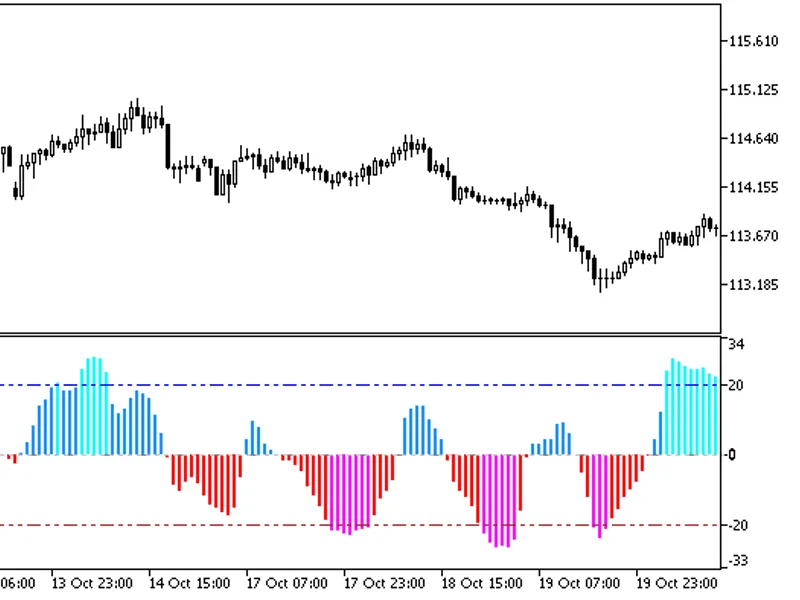
Smoothed Relative Strength Index (RSI) oscillator with color indication for overbought/oversold level breakouts and histogram direction.The coloring method can be selected via the ...
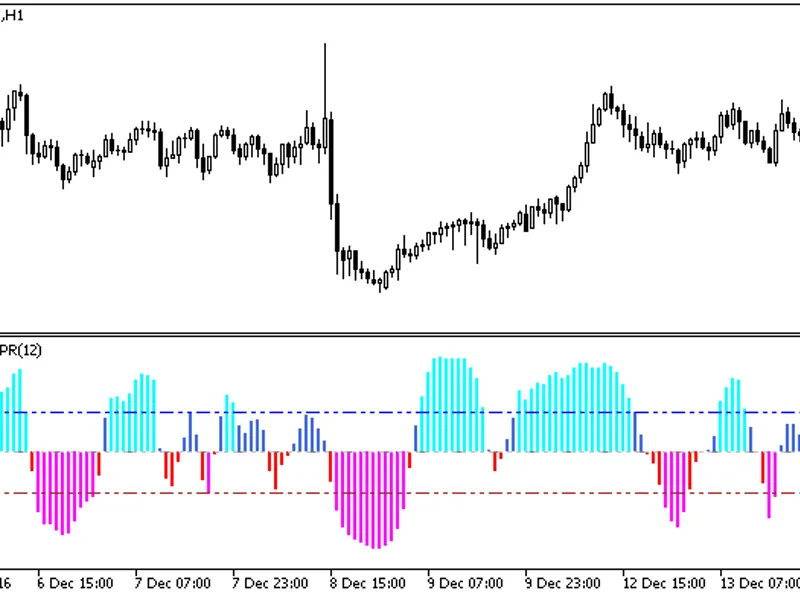
Smoothed Larry Williams' Percent Range Oscillator with color indication for overbought/oversold level breakouts and histogram direction changes.Depending on the indicator's input p...
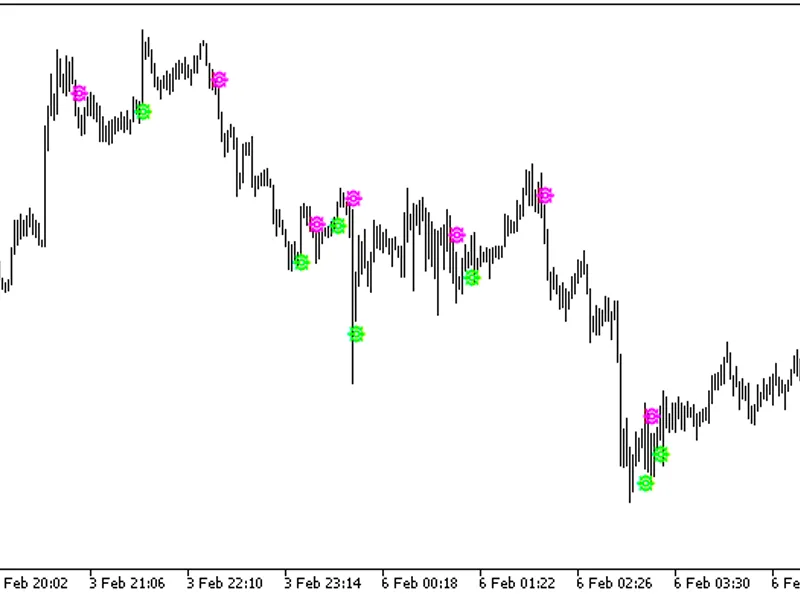
The XO Signal indicator is a semaphore-based signal tool.Its core functionality does not involve averaging algorithms.Figure 1 displays the XO Signal indicator....
Smoothed Money Flow Index oscillator with color indication for overbought/oversold level breakouts and histogram direction changes.The indicator's coloring behavior is determined b...
Smoothed Ichimoku Oscillator.
This indicator was first implemented in MQL4 and published on 03.29.2026.The indicator uses the SmoothAlgorithms.mqh library classes. Ensure these cla...
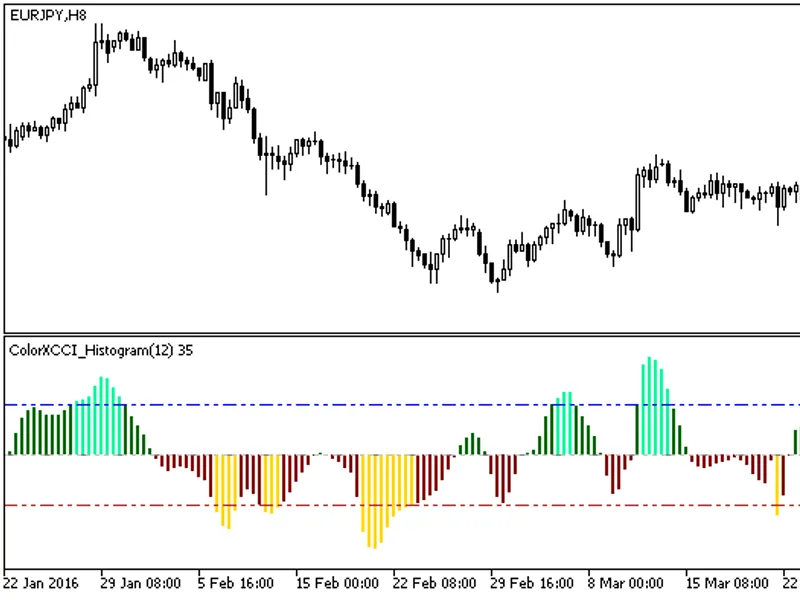
Smoothed Commodity Channel Index (CCI) oscillator with color indication for overbought/oversold level breakouts and histogram direction changes.
Based on the input parameter 'mode...
Color MACD Digit Indicator
This indicator displays a rounded MACD histogram directly on the price chart, with adjustable rounding input variables.
The original implementation of ...
TTM Trend HTF Indicator with Timeframe SelectionThis indicator includes a timeframe selection option within its input parameters.To ensure proper functionality, please place the co...
The smoothed Demark oscillator with color indication of overbought/oversold level breakouts and histogram direction.Depending on the value of the indicator's input parameter 'mode'...
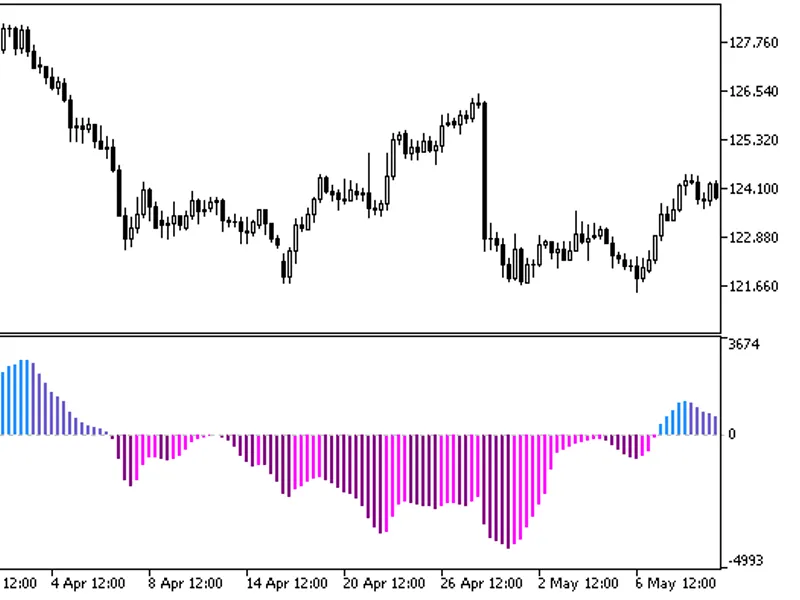
Smoothed indicator with color highlighting for overbought/oversold level breakouts and histogram direction changes.The indicator offers two coloring modes, determined by the input ...
The Figure Builder tool allows you to draw a shape on your chart based on a specified number of points.To add a point, press and hold the CTRL key and left-click on the chart.Once ...
This indicator identifies potential price reversals based on specific three-candle patterns.Bullish Reversal Pattern:A bullish candlestick is followed by another bullish candlestic...
Khaos Assault HTF Indicator with Timeframe SelectionThis indicator includes a timeframe selection option available in the input parameters.To ensure correct operation, please add t...
Ichimoku Oscillator Indicator with Higher Timeframe (HTF) Option.This indicator includes a timeframe selection option within its input parameters.To ensure correct operation, pleas...
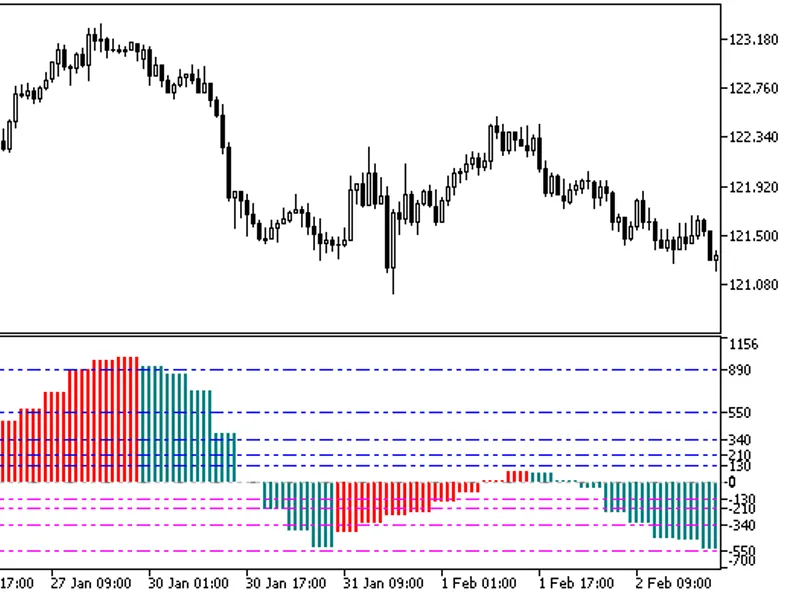
An indicator of financial asset volatility using the OSMA oscillator.Indicator Formula:JuiceZ = ( abs(OSMA) / Point ) - LevelWhere:abs(OSMA) - absolute value of the OSMA indicator;...
The Color Standard Deviation Histogram HTF indicator includes a timeframe selection option in its input parameters.To ensure proper functionality, place the compiled colorstd_histo...
The KI Signals indicator generates trading signals based on histogram values.It supports three trading signal variants, determined by the input parameter 'mode':- Change of histogr...
Color XDE Marker Histogram HTF Indicator with Timeframe SelectionThis indicator features a timeframe selection option available in the input parameters.To ensure correct operation,...