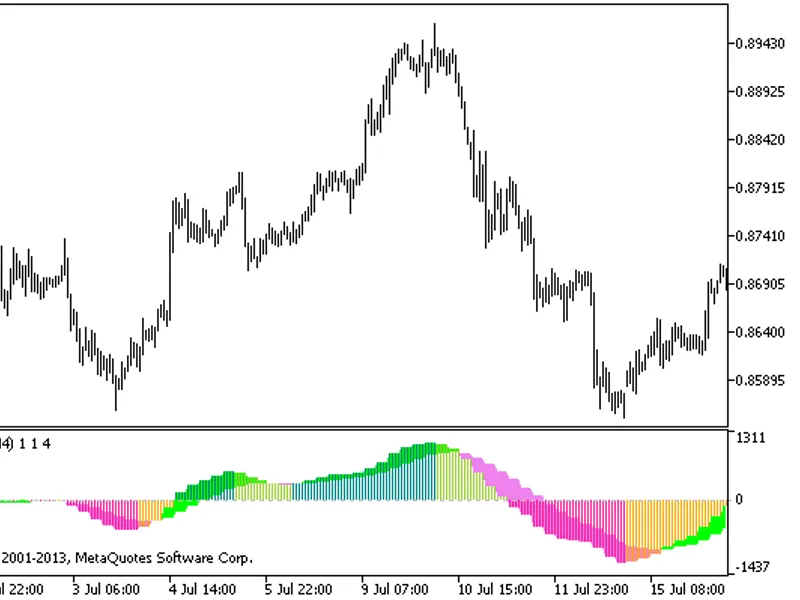
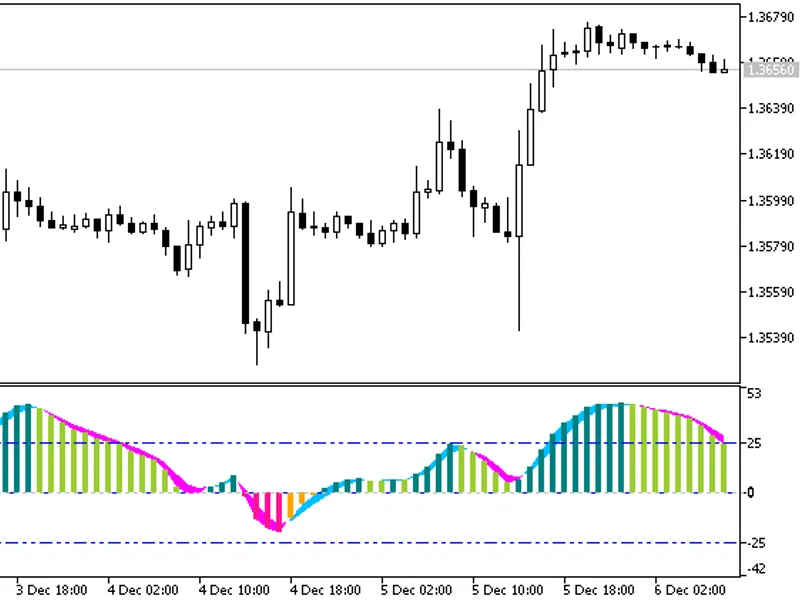
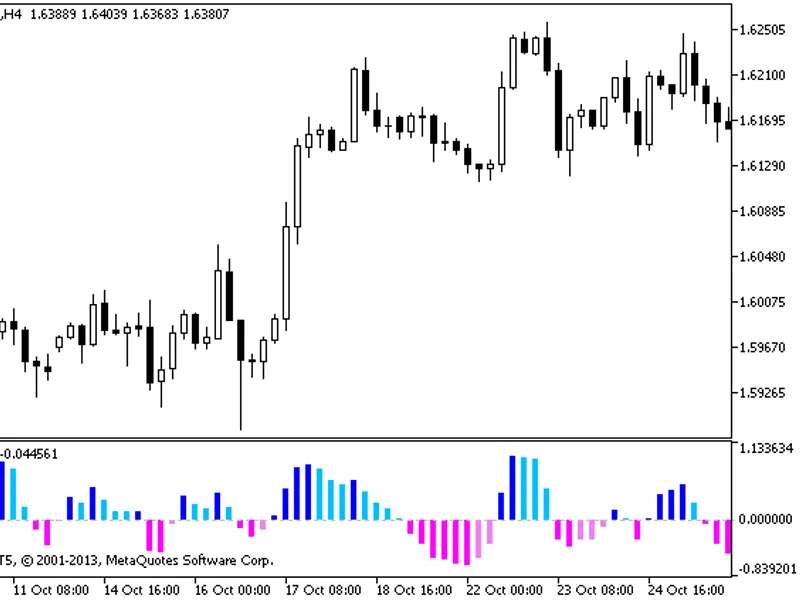
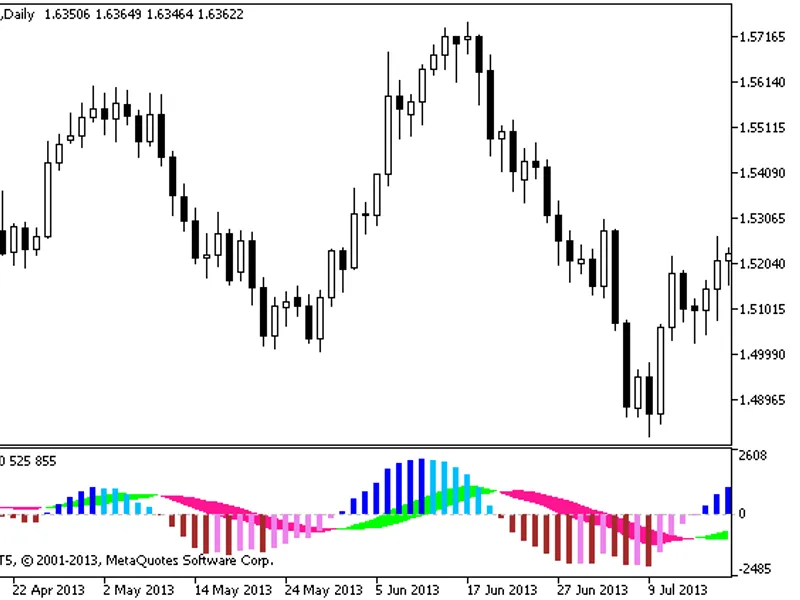
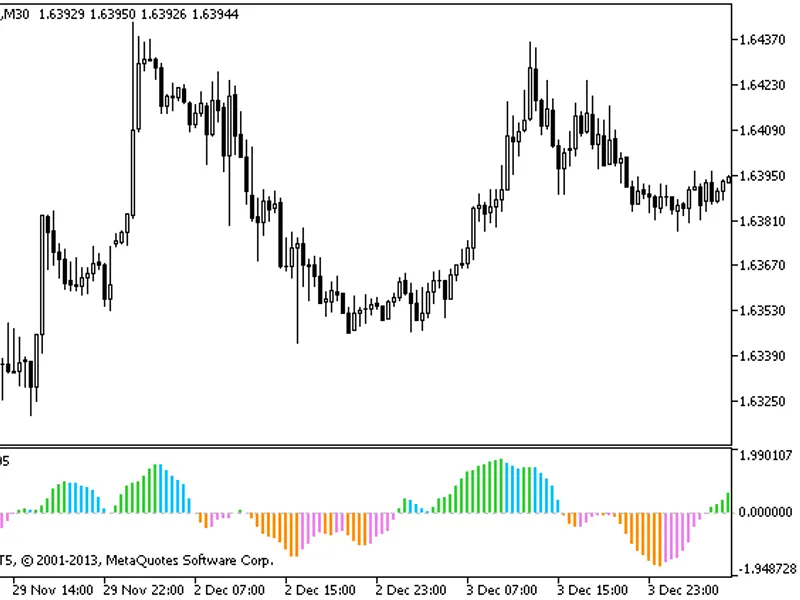
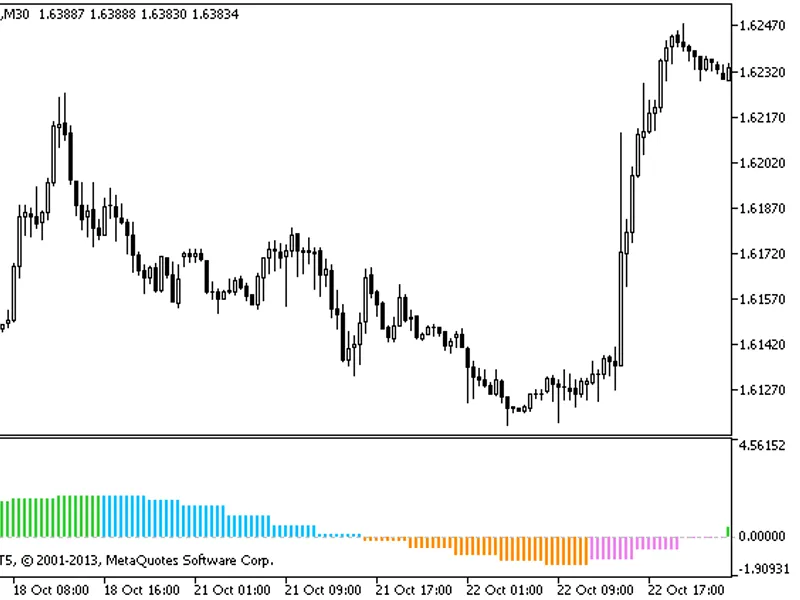
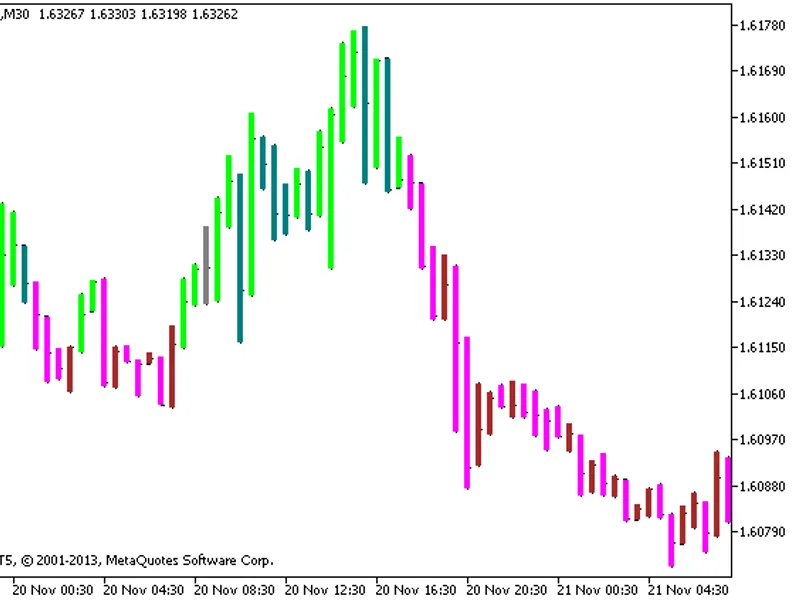
The Blau Ergodic Divergence Indicator with a Timeframe Selection option in input parameters.Blau Ergodic Divergence Indicator MTFThis indicator includes a timeframe selection featu...
ASCTrend HTF Indicator with Timeframe SelectionThe ASCTrend HTF indicator includes an option for timeframe selection directly within its input parameters.Figure 1. The ASCTrend_HTF...
Awesome Signal Indicator
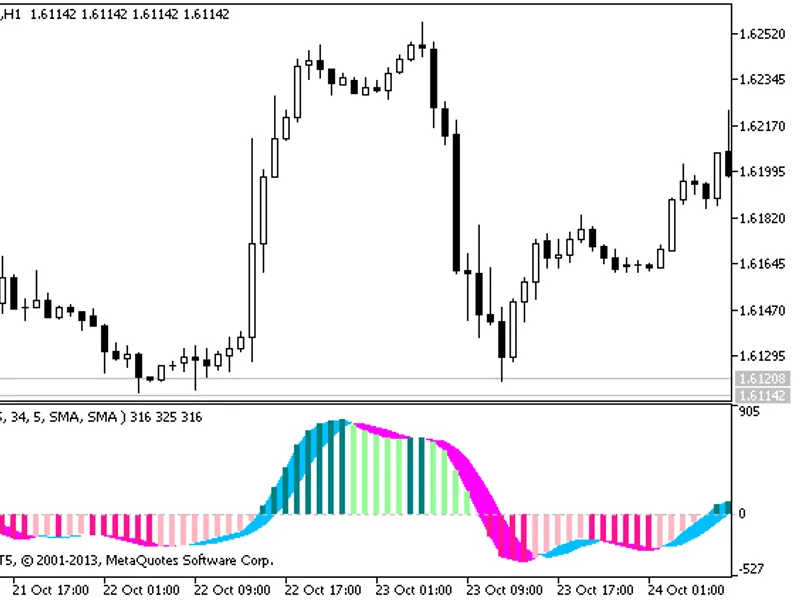
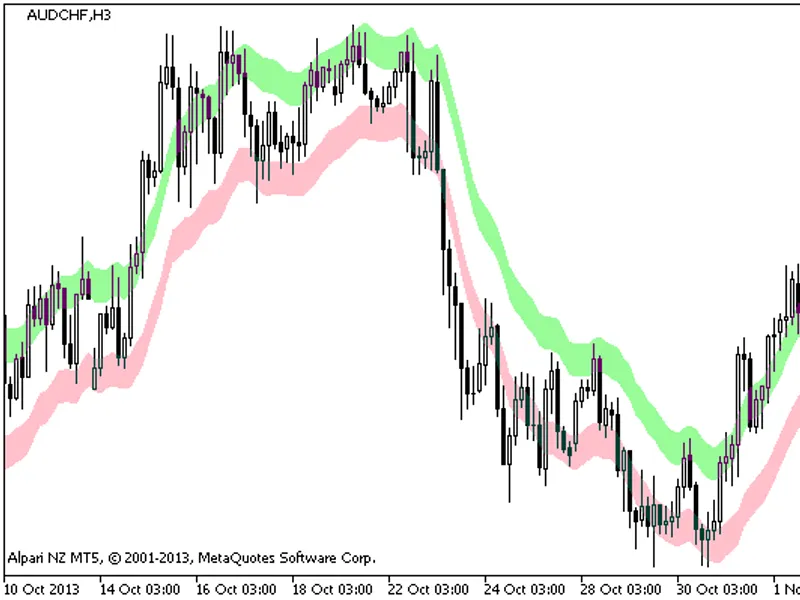
Bill Williams' Awesome Oscillator with adjustable parameters and an additional signal line represented as a colored cloud.
The indicator utilizes classes...
Accelerator Signal Indicator with Fine-Tuning and Cloud SignalThis indicator, based on Bill Williams' Accelerator concept, offers enhanced functionality with fine-tuning options an...
DeMarker 3-Timeframe Indicator displays three DeMarker oscillators using three distinct timeframes on a single chart.Figure 1 shows the DeMarker 3HTF indicator.This indicator is de...
MACD On Chart Indicator
This indicator utilizes a semaphore signal approach with a histogram.The indicator generates trading signals when the MACD histogram crosses its signal lin...
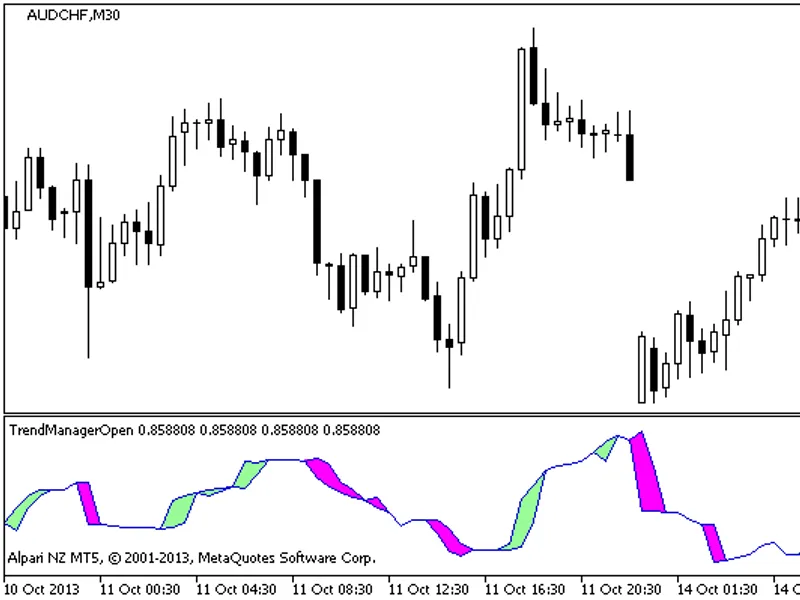
Trend detecting indicator displayed as a colored cloud.This indicator was originally developed in MQL4 and first published on November 6, 2026.Figure 1. The TrendManagerOpen Manage...
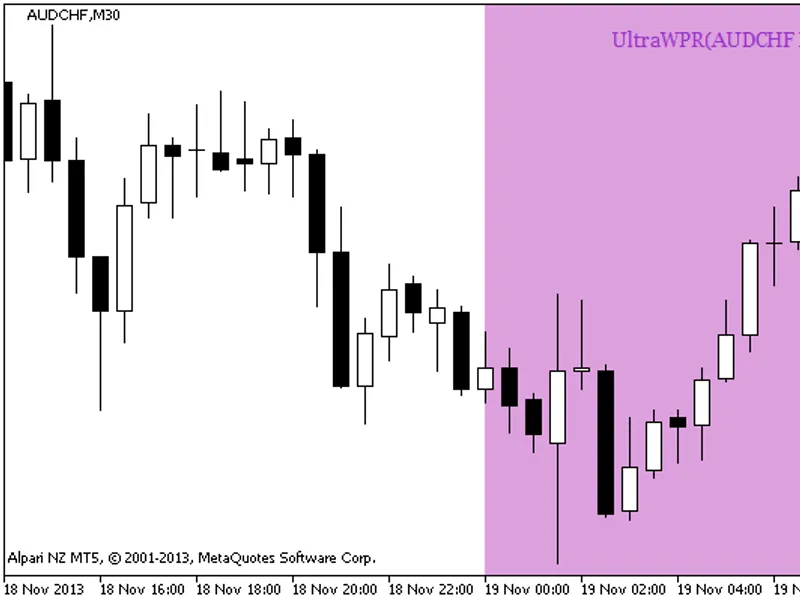
Ultra WPR HTF Signal BG displays trend direction using indicator data on a selected bar.It presents this information as a graphic object with colored backgrounds indicating trend o...
Trend Value HTF Indicator with Timeframe SelectionThis indicator includes a timeframe selection option within its input parameters.To install, place the compiled indicator file, tr...
Accelerator Signal HTF Indicator with Timeframe SelectionThis indicator includes a timeframe selection option directly within its input parameters.To install the indicator, place t...
This is an indicator with a timeframe selection option available in the input parameters.Installation InstructionsTo use the indicator, place the compiled file awesome_signal.mq5 i...
Description:
this indicator is a modification of the classical awesome indicator.
It computes the smoothed rate of change of two smoothed moving averages.
More precisely, the in...
The Blau TS Stochastic indicator is based on the stochastic oscillator concept from the book by William Blau and is displayed as a color histogram with a signal line in the form of...
This is a MetaTrader indicator with the timeframe selection option available in input parameters:
It allows for the selection of the timeframe to be used in the calculation of the...
This is a trend indicator with three states. During strong trends it colors bars in red or green depending on fall or rise. If there are no strong trends, the bar is gray.The indic...
The indicator with the timeframe selection option available in input parameters:
This feature allows for more flexibility in trading decisions.
Figure 1. Indicator UltraWP R HTF
In...
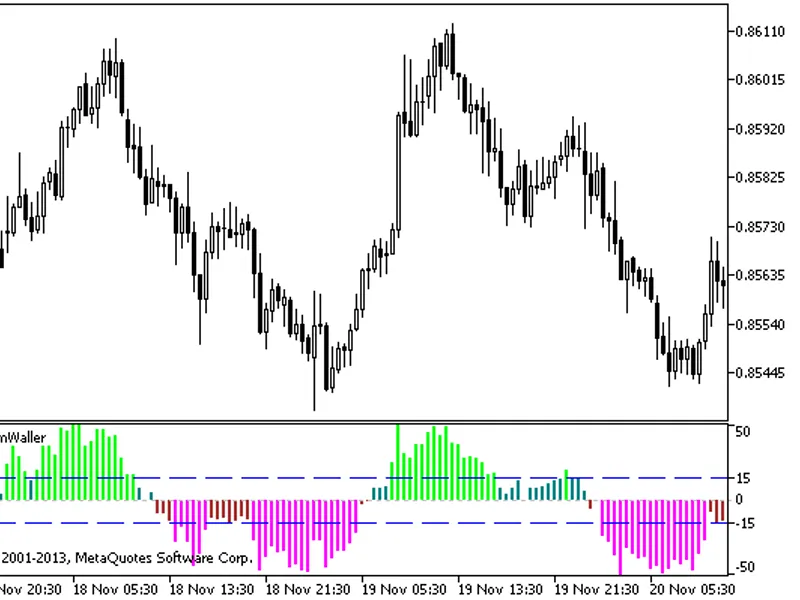
A trend indicator displayed as a colored histogram.There are four color histogram display options based on input parameter values:- Above the overbought level: pink- Above zero but...
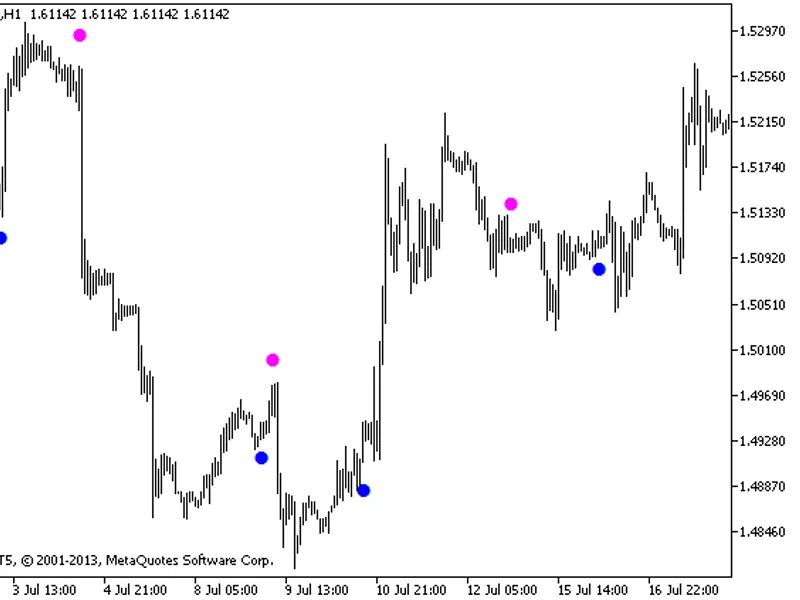
TTF Plus MW is a semaphore arrow signal indicator that places colored dots to signal potential trading opportunities.The indicator utilizes classes from the smoothalgorithms.mqh li...
Woodie's CCI is a widely used indicator that employs two Commodity Channel Index (CCI) components with different calculation periods. This indicator was originally developed in MQL...
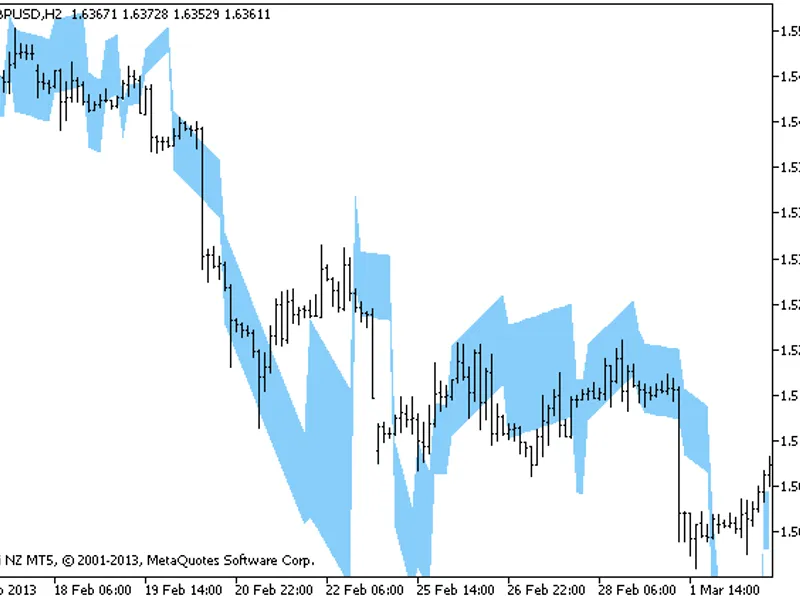
Keltner Channel HTF is an indicator that includes a timeframe selection option within its input parameters.To install the indicator, place the compiled file, keltner.mq5, into the ...
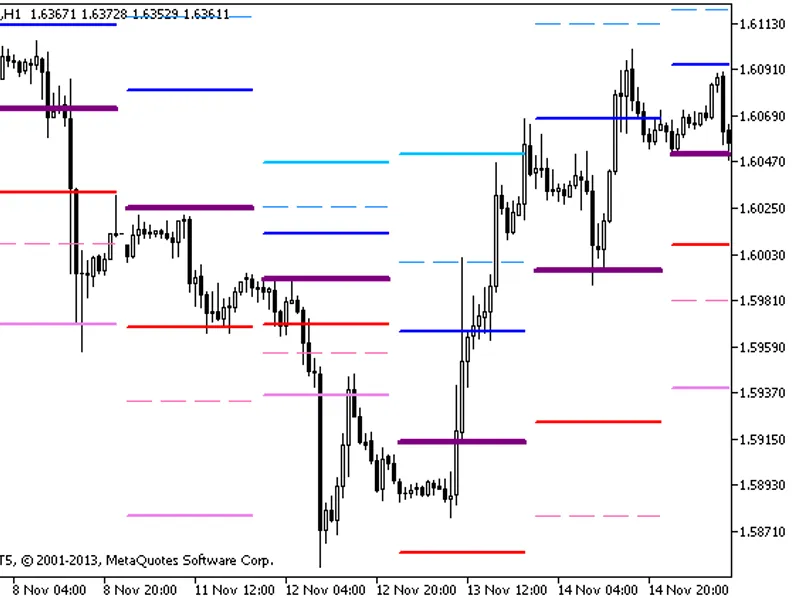
Pivot Levels Indicator (Pivot-2)This indicator provides a set of pivot levels.The original version of this indicator was developed in MQL4 and first published on November 5, 2007.F...
This indicator calculates four moving averages based on the averaged values of the open, low, high, and close prices of a candlestick chart.The indicator utilizes smoothing algorit...
Standard Deviation Channels indicator displays two automatically positioned channels on the chart.This indicator was originally written in MQL4 and first published on 05.11.2026.Fi...
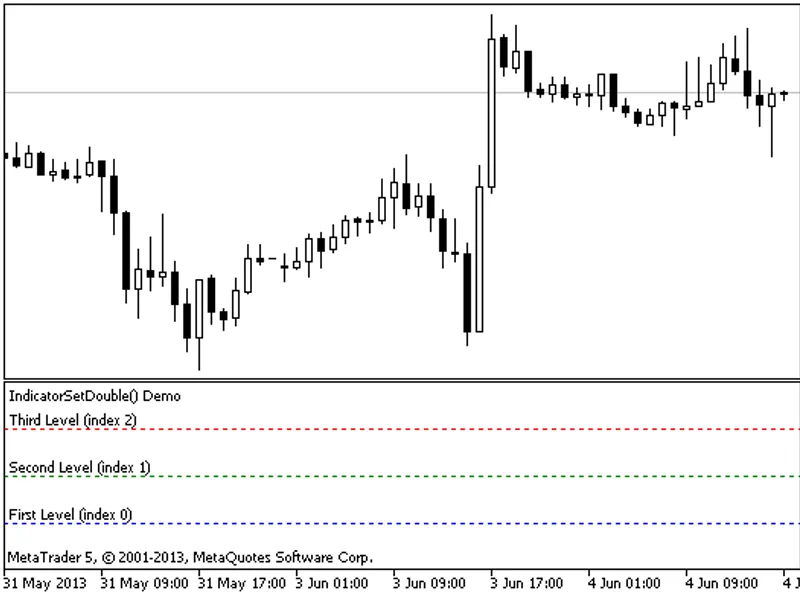
This indicator demonstrates the functionality of reversing the maximum and minimum values displayed within the indicator window. It also inverts the values of pre-defined horizonta...
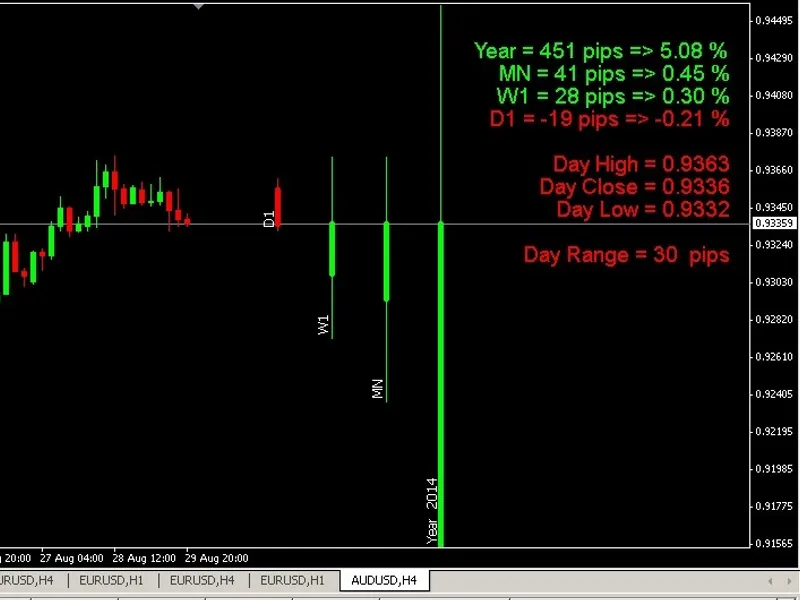
This is a MetaTrader 4 indicator.Candle Direction PanelsThis indicator provides visual panels that display the direction of candles on your chart. It is designed for the MetaTrader...
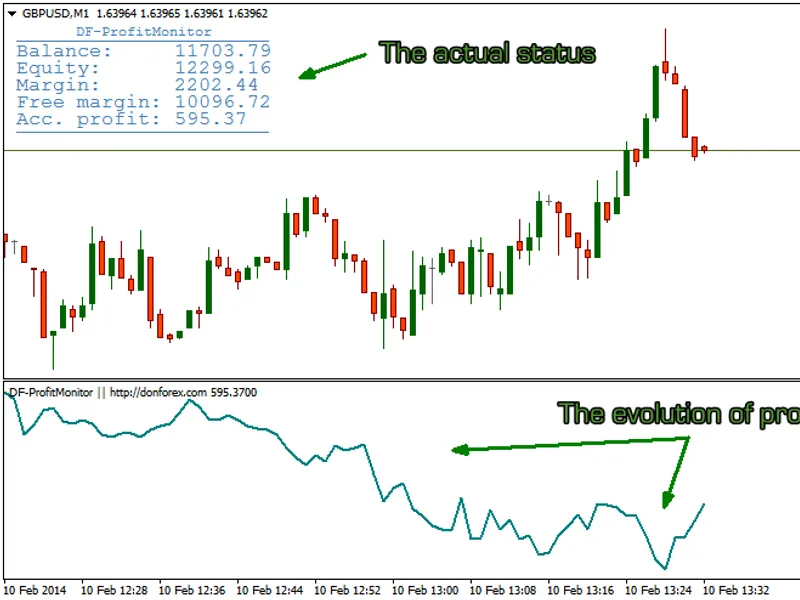
This is a simple and very useful indicator to follow the evolution of profit.It displays the actual status of the account in the main window and the profit curve in a subwindow.The...
The Rose Pips Indicator is a technical analysis tool designed for MetaTrader 4.It assists traders in identifying potential pips for entry and exit points within the forex market....
Visualize multi-timeframe bars on a single chart.To see the label of each bar (m1, m15, m30, etc.), enable "show object descriptions" in the chart properties' common tab.Version 1....
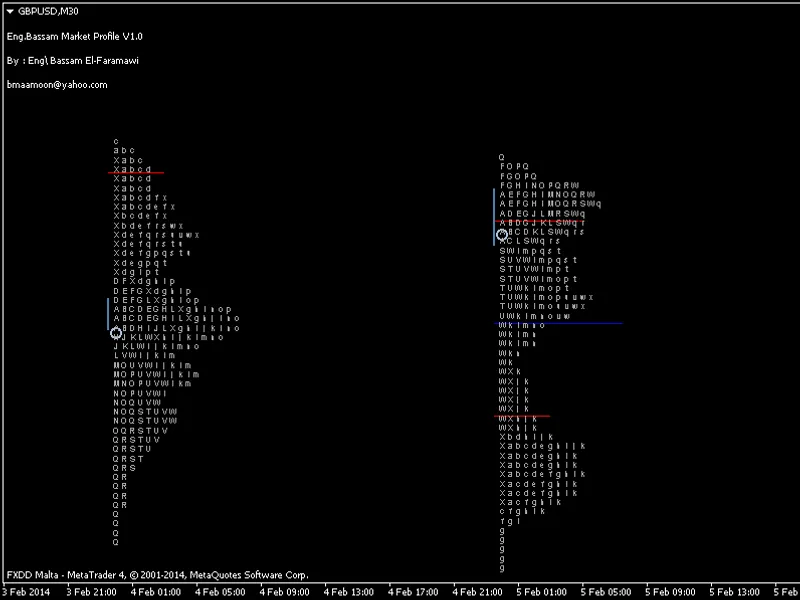
The indicator simulates the full structure of the market profile system described by James Dalton in his book Mind Over Markets for the market profile day trader, including TPOs, P...
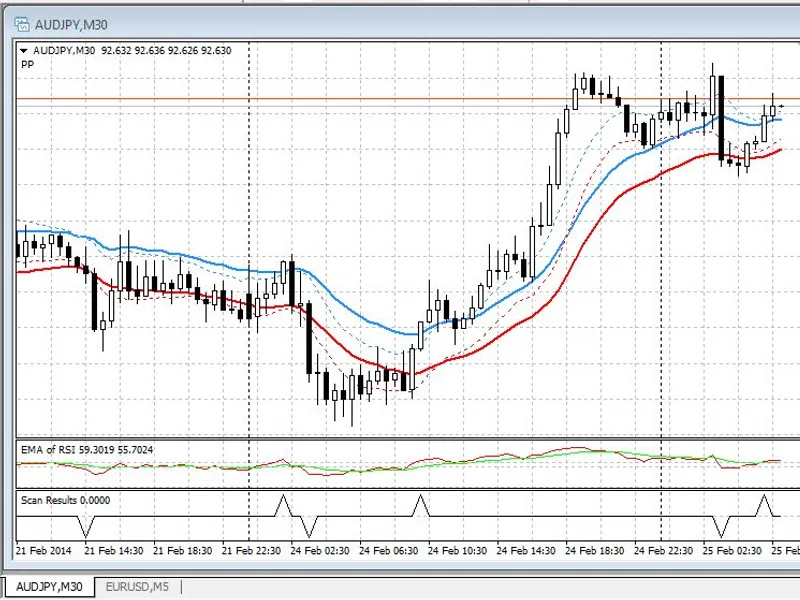
Condition Scanner (CS) - A Tool for Automated Trading Strategy TestingThe Condition Scanner is a powerful utility designed to help traders automate the process of identifying tradi...
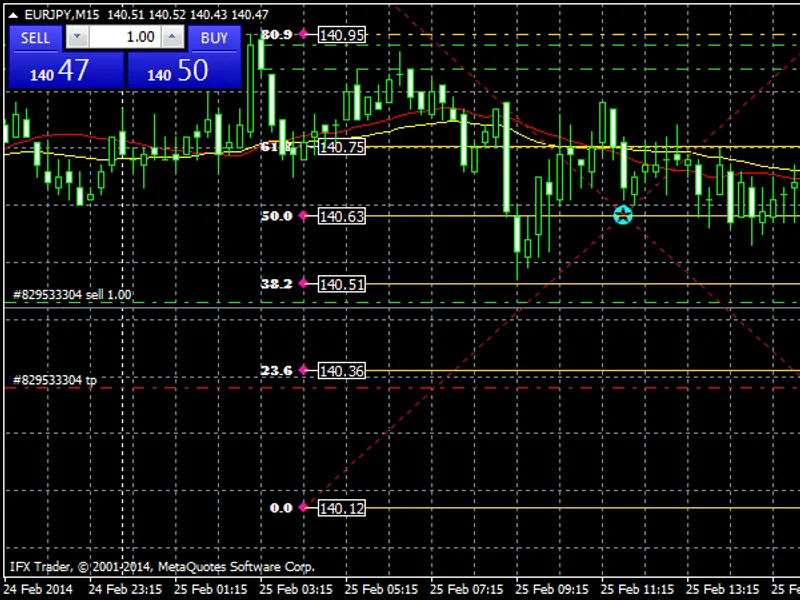
Fibonacci Retracement Levels IndicatorThis indicator draws Fibonacci retracement levels on your trading chart.Version 2 introduces price labels for each Fibonacci level.The code ha...
Blau SM Stochastic HTF Indicator with Timeframe SelectionThis indicator features an option to select the timeframe directly within the input parameters.Figure 1. The BlauSMStochast...
A non-normalized oscillator implemented as a color histogram.Calculation Formula:This indicator was originally developed in MQL4 and first published on November 2, 2026.Figure 1. T...
A visual representation of the MACD and signal lines in the form of a colored cloud.This indicator was originally developed in MQL4 and first published on 02.11.2026.Figure 1. MACD...
EM Bands IndicatorThis indicator draws two channels based on the high and low of the price series.The indicator was originally written in MQL4 and was first published on November 1...
Pivot Fibonacci IndicatorA set of Fibonacci levels integrated with pivot points, drawn on daily candlesticks.This indicator was originally developed for MQL4 and first released on ...
SK B-1 IndicatorThis indicator was originally developed in MQL4 and first published on November 1, 2007.It is implemented as a cloud-based solution.Figure 1. SK B-1 Indicator...
Ergodic Oscillator by William Blau, presented as a color histogram with a signal line represented by a colored cloud.The indicator utilizes classes from the smoothalgorithms.mqh li...
Fisher MBKA normalized oscillator presented as a color histogram.Originally developed in MQL4 and first published on November 1, 2026.Figure 1. Fisher MBK Indicator...
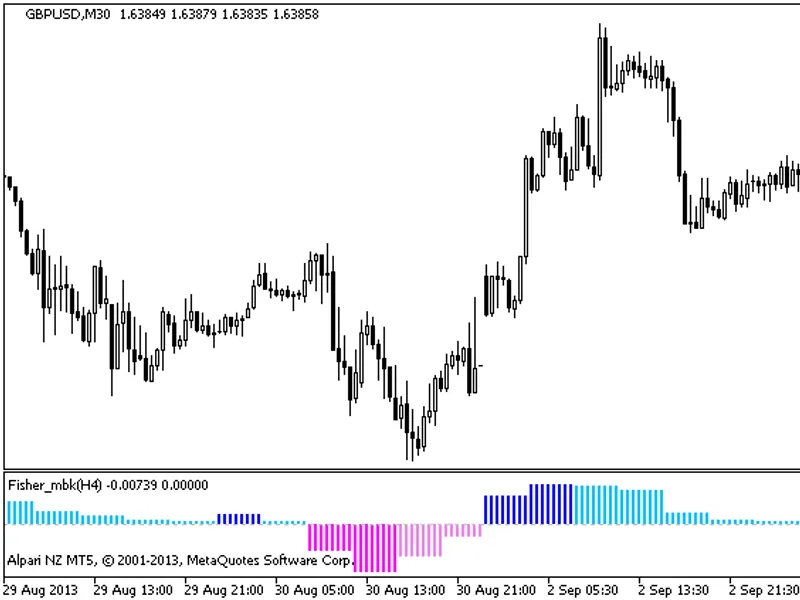
Fisher MBK HTF Indicator with Timeframe SelectionThis indicator includes a timeframe selection option available in the input parameters.To install, place the compiled indicator fil...
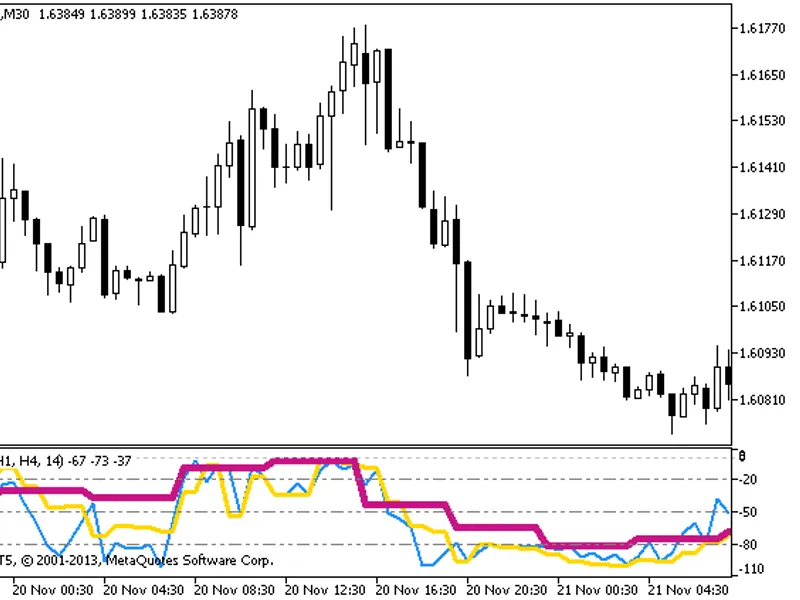
The WPR 3HTF indicator displays three different timeframes of the Williams Percent Range (WPR) indicator on a single chart.This allows traders to quickly assess the WPR conditions ...
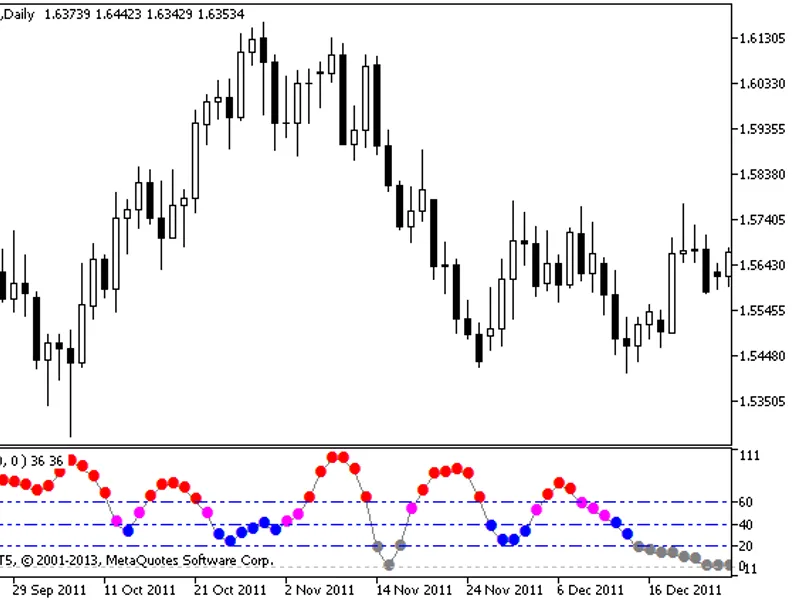
The Flat indicator measures market volatility.During strong trends, the indicator dots turn red. During weak trends, the dots are gray. Moderate trends are shown in blue.Indicator ...
The indicator displays as a colored cloud, with the difference between the MACD and the signal line presented as a colored histogram.This indicator was originally developed in MQL4...
The Fish HTF indicator features a timeframe selection option directly within its input parameters.To install, place the compiled indicator file, fish.mq5, into the terminal_data_fo...
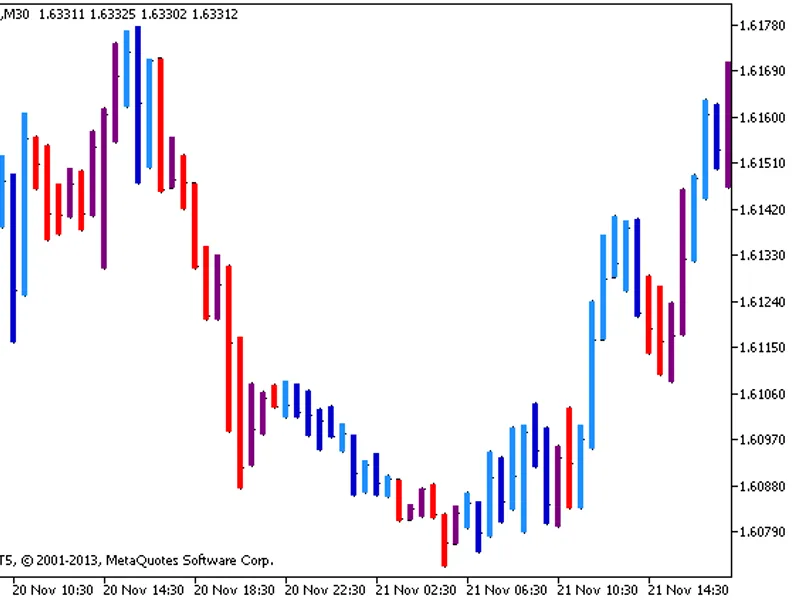
The indicator changes the bar color based on the current trend, calculated using the ADX technical indicator.If the trend and candlestick direction match, the bar color is light.If...
The RVI Bars indicator changes the color of the price bars to reflect the current trend.The trend is determined using the Relative Vigor Index (RVI) indicator.If the trend and cand...
MaksiGen Range Move is a flat determining indicator.If the price is within the dotted channel, the market is considered flat.This indicator was originally written in MQL4 and first...