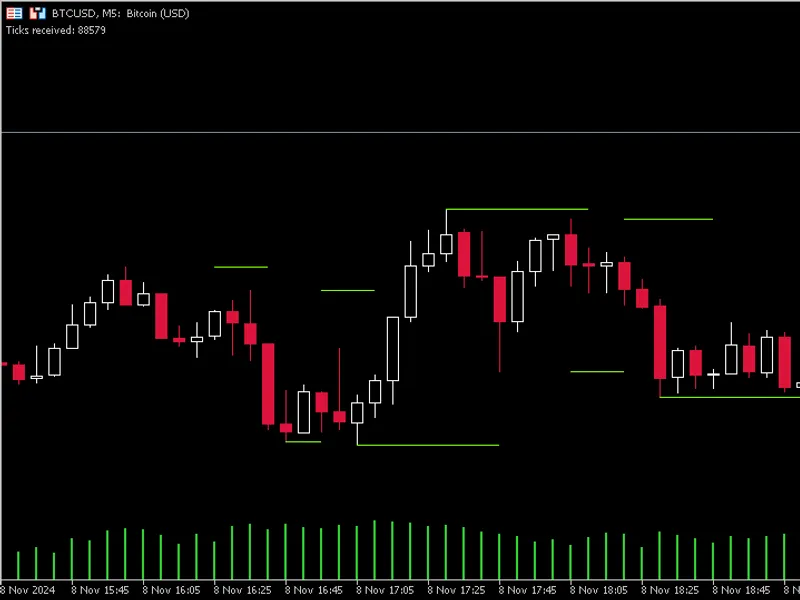
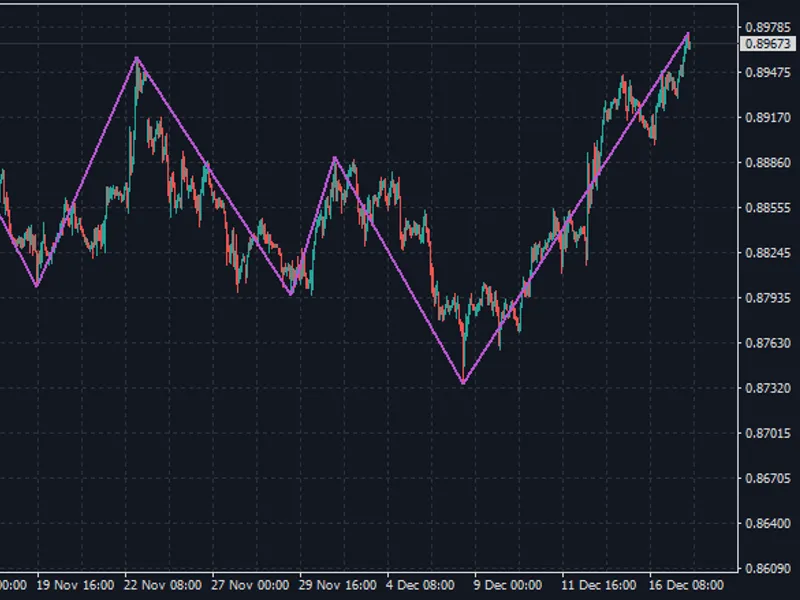
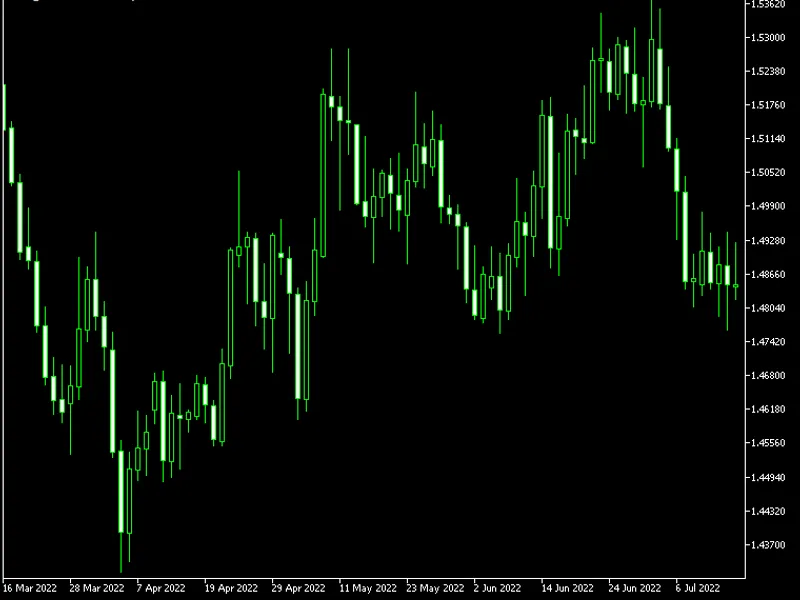
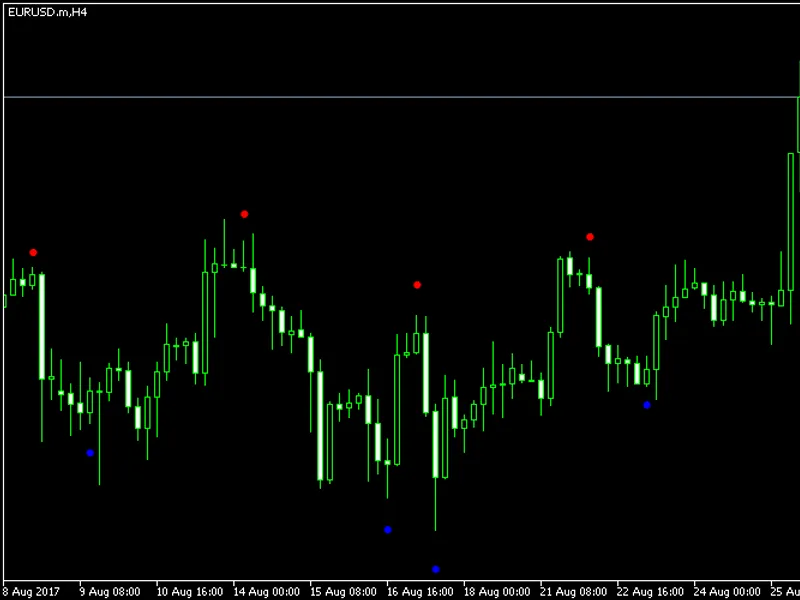
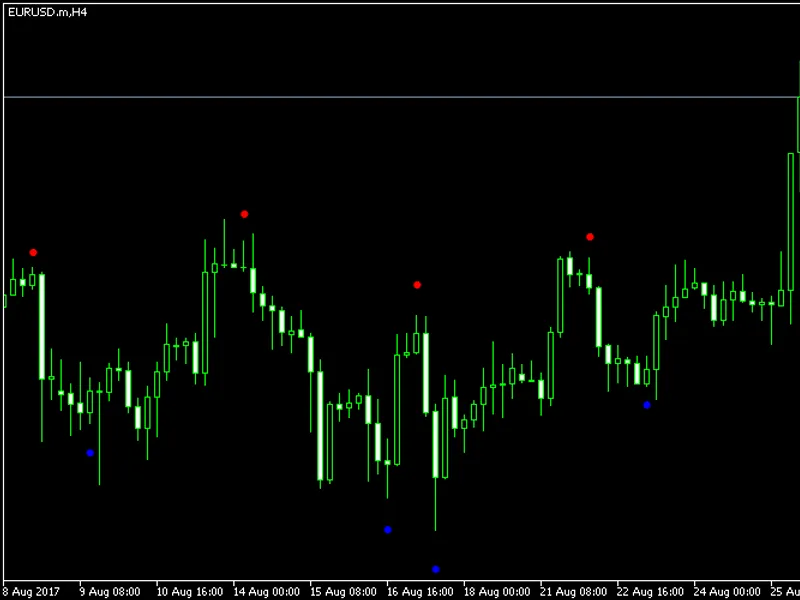
an indicator to mark extremums with lines. a period input is used to determine highest highs and lowest lows for that period. in this indicator, it's not only highs and lows (ohlc)...
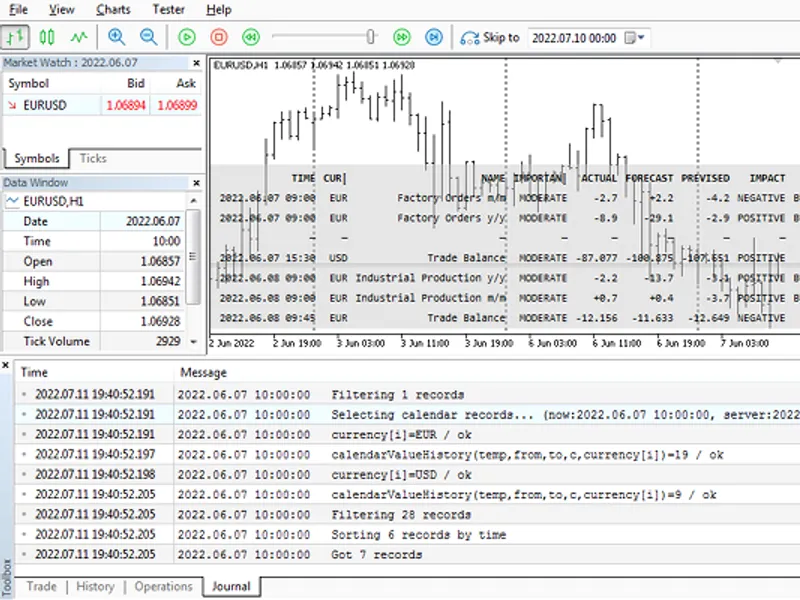
to make a long story short: the built-in economic calendar of metatrader 5 is not (completely) synchronized with historical quotes. quotes are marked with timestamps in accordance ...
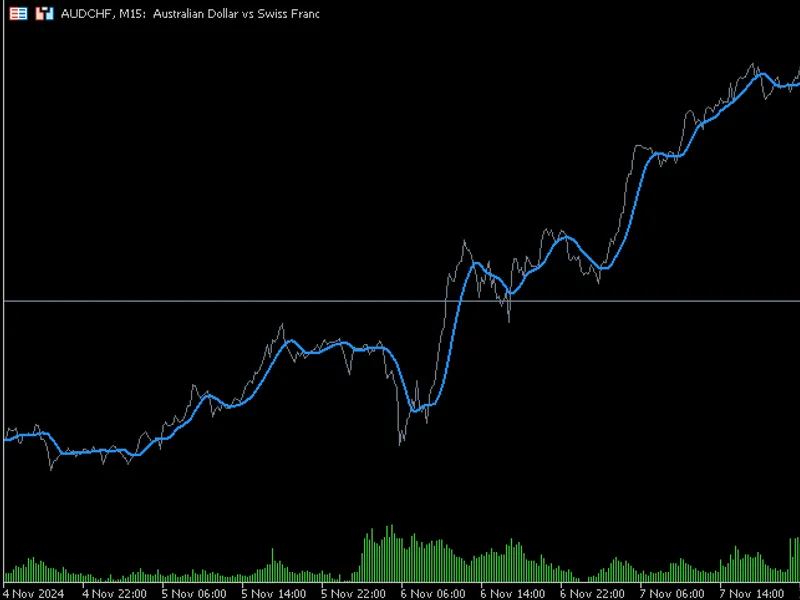
a simple indicator to make a smoother line chart while also using tick volume to determine the market direction.the basic idea is to give you the true direction of where the market...
in short, there are three indicator lines p1, p2, p3.according to which trajectory p3 sticks there and the price forecast.at the moments of a clear upward or downward movement, all...
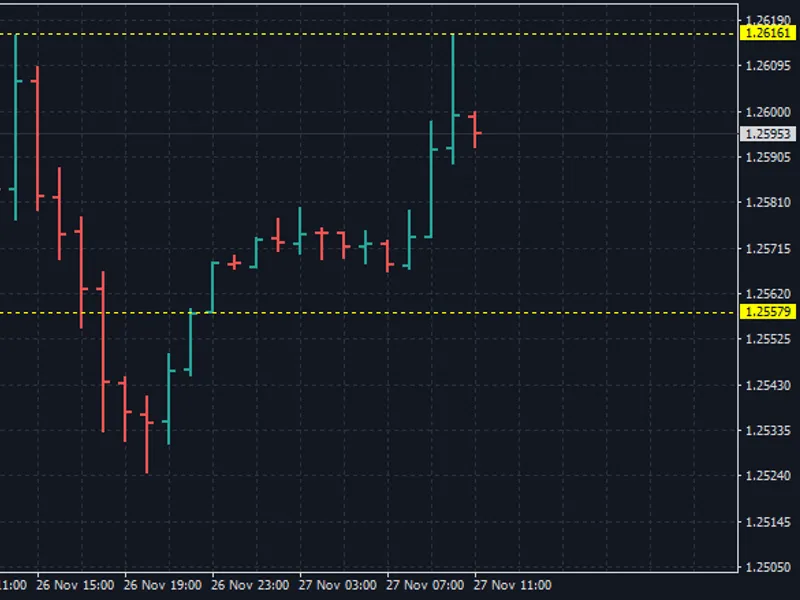
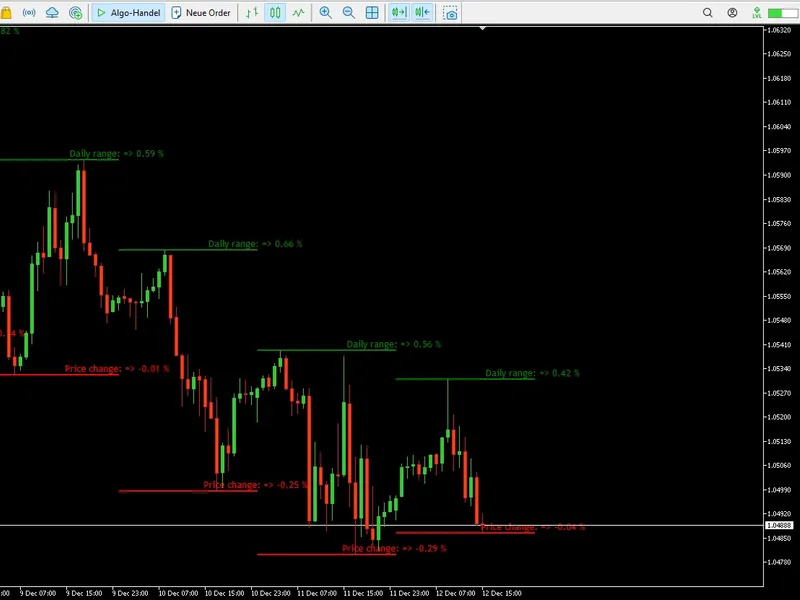
the indicator draws the nearest levels of the specified price range.in the settings, you can choose what to measure the range in, points or percentages.the principle of the indicat...
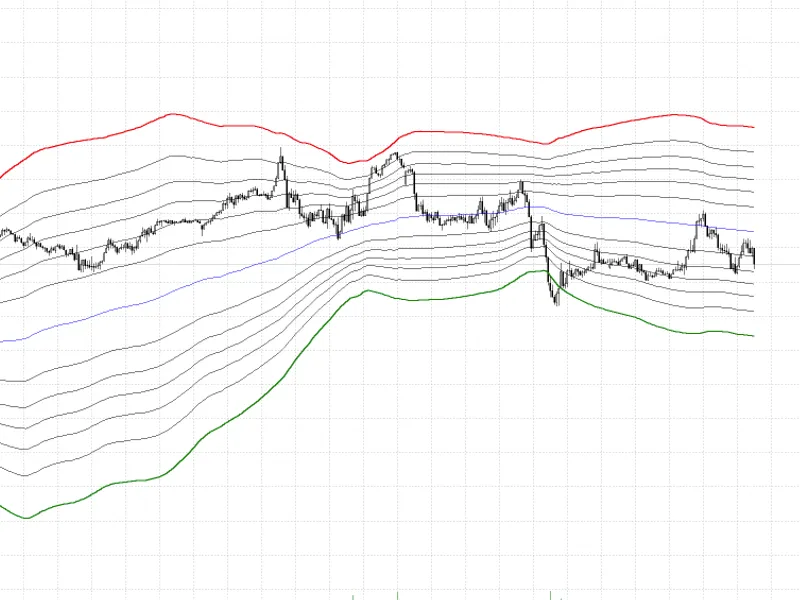
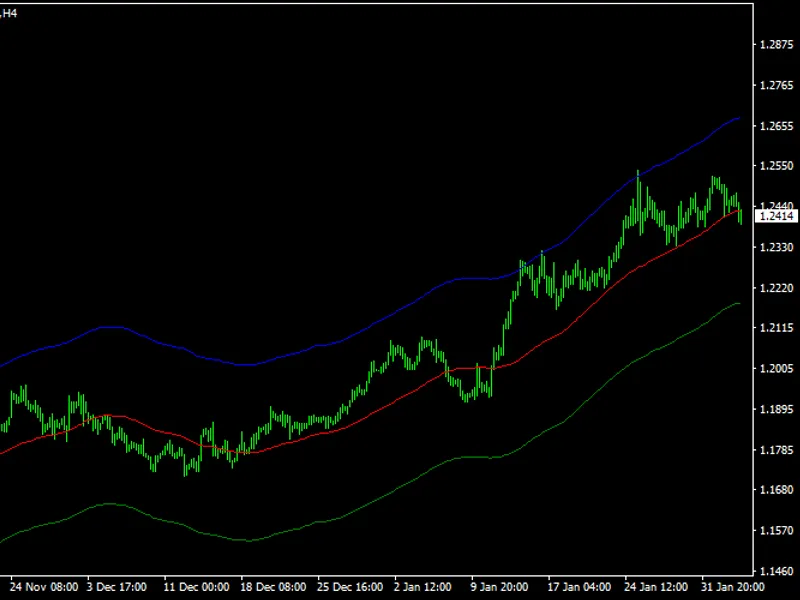
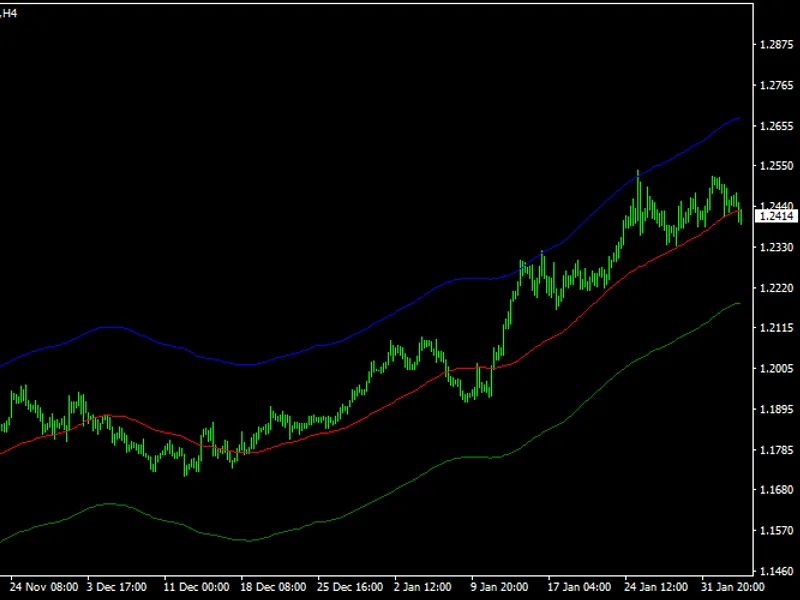
features: automatically calculates fibonacci levels on bollinger bands. provides a unique perspective for breakout and reversal trades. fully compatible with metatrader 5. perfect ...
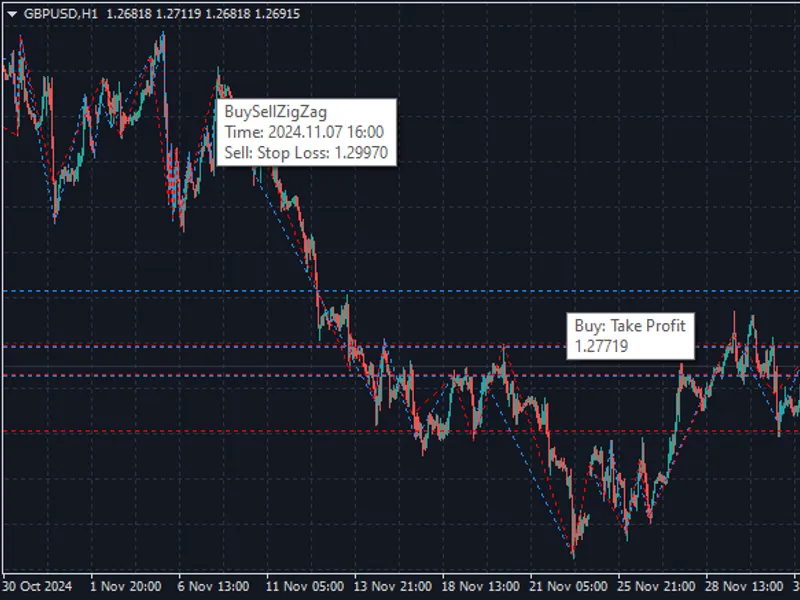
double zigzag draws virtual buy and sell levels on the price chart.the tp and sl sizes are set in the settings and the indicator draws two zigzags: one draws the extremes of the bu...
1. you can display the level lines that correspond to the last extremes (maximum / minimum) of the zigzag. 2. enable displaying the size of the waves in points. indicates how many...
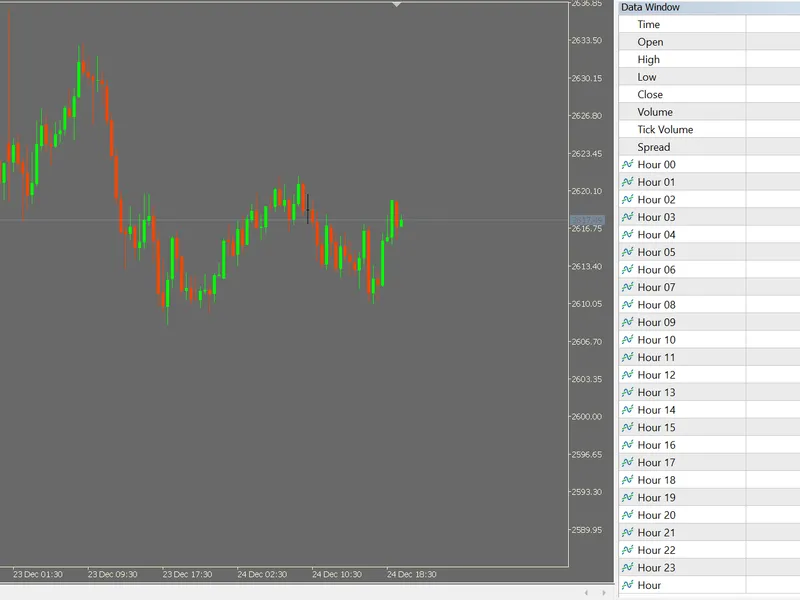
purpose users may collect data for modelling. time dummies are frequently used in economic modelling. the simple indicator below, which can easily be expanded upon, provides each h...
this is a simple indicator to calculate moving averages based on timeframe that currently viewed.the calculations are generally based on timeframe window and moving average's perio...
the indicator shows the names of the days of the week, as text labels on the chart.the indicator has input parameters:it shows labels on chart as follow...
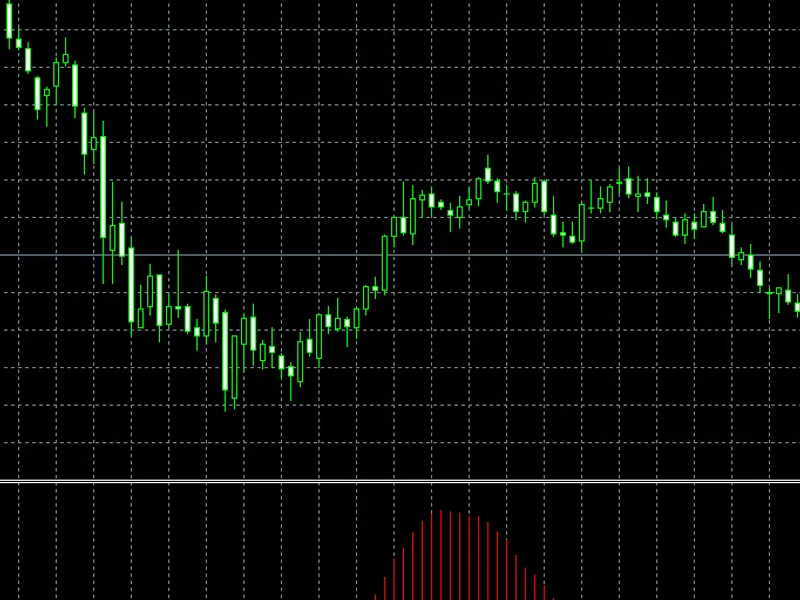
settings and parameters general parametersmomentum periodthe number of candles used to calculate momentum.recommended value: 14(the higher the value, the smoother the curve, but wi...
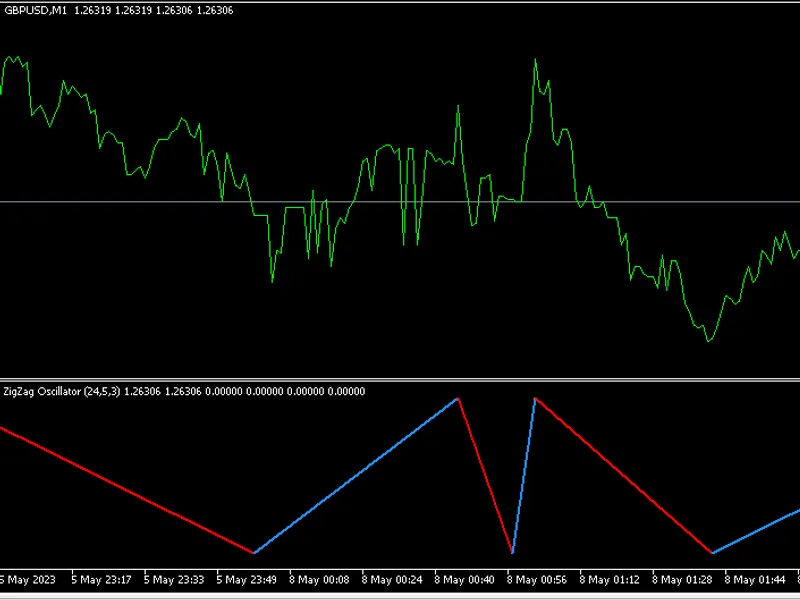
here are some differences and advancements:- the zigzag has two modes "oscillator" and "highlow". the oscillator mode will show a visual oscillation of the zigzag swings, even thou...
input parameters showbodysize(default = false) — if true, a candle's body size will also be shown.havepipettes(default = false) — if true, the indicator will assume that the curren...
input parameters showbodysize(default = false) — if true, a candle's body size will also be shown.havepipettes(default = false) — if true, the indicator will assume that the curren...
negative volume index (nvi)is a free technical indicator for advanced chart analysis in mt4, mt5 platforms. it is based on tick volume (can be substituted with real volume in mt5) ...
negative volume index (nvi)is a free technical indicator for advanced chart analysis in mt4, mt5 platforms. it is based on tick volume (can be substituted with real volume in mt5) ...
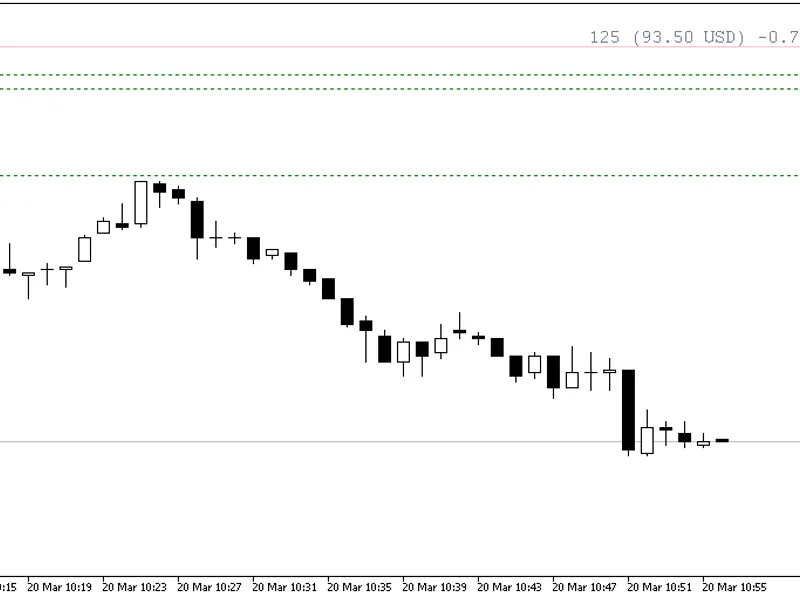
breakeven line indicatoris a metatrader indicator that calculates breakeven level based on all open positions and displays it on your chart as a horizontal line. additionally, it w...
breakeven line indicatoris a metatrader indicator that calculates breakeven level based on all open positions and displays it on your chart as a horizontal line. additionally, it w...
input parameters ma_period (default = 50) — a period of the 3rd generation moving average. ma_sampling_period (default = 220) — a sampling period of the 3rd generation moving avera...
input parameters ma_period (default = 50) — a period of the 3rd generation moving average. ma_sampling_period (default = 220) — a sampling period of the 3rd generation moving avera...
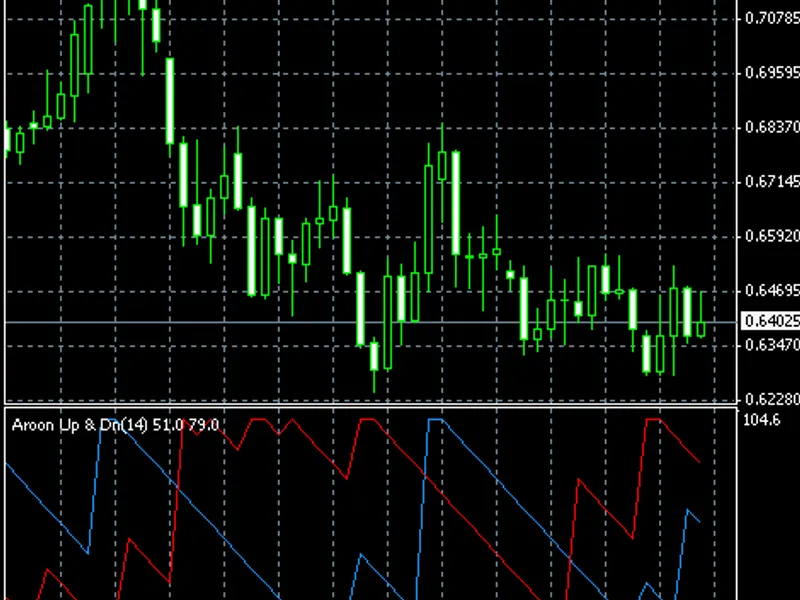
input parameters aroonperiod (default = 14) — the period in chart bars for the indicator to look up for the bottoms and the tops. as with many other indicators, the higher is the p...
input parameters aroonperiod (default = 14) — the period in chart bars for the indicator to look up for the bottoms and the tops. as with many other indicators, the higher is the p...
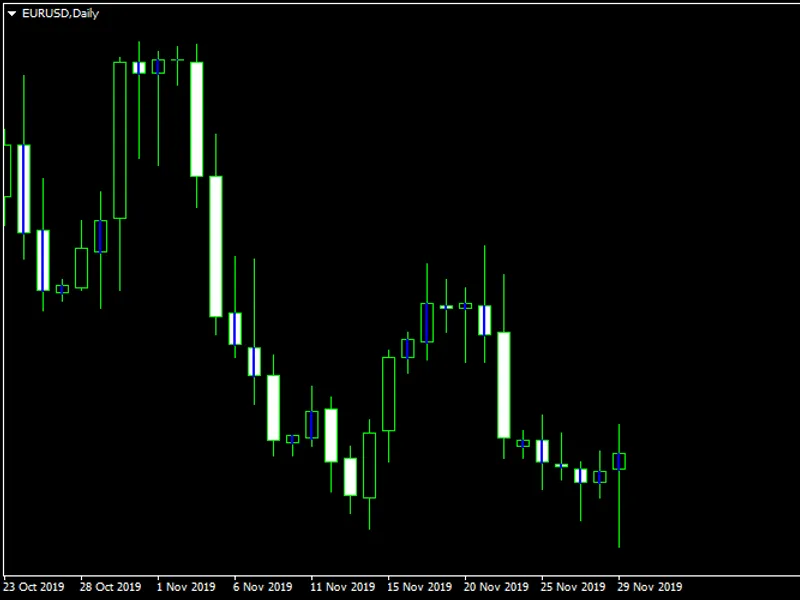
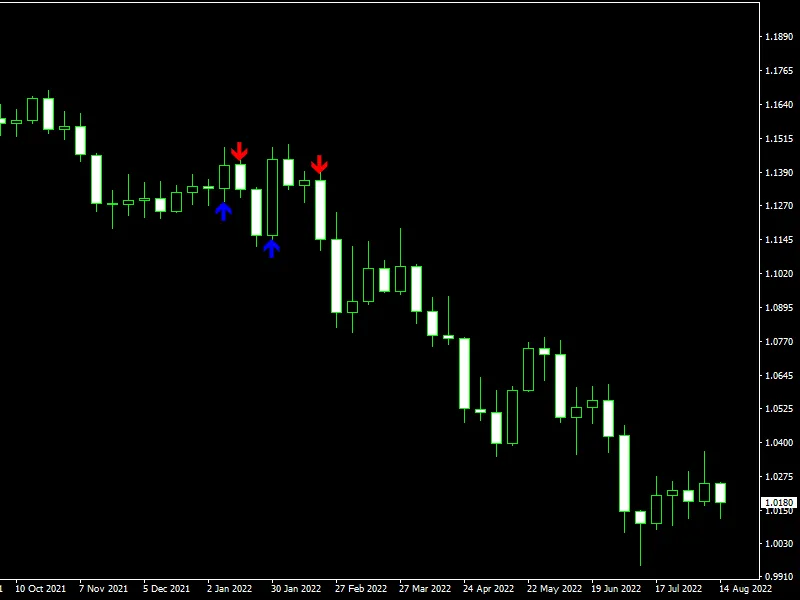
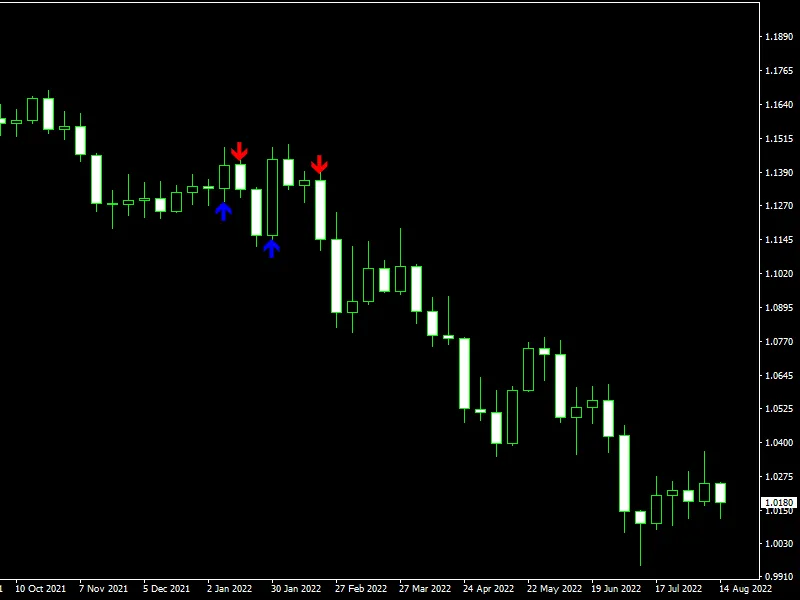
basing candlesticks metatrader indicator— is an automatic indicator that detects and marks basing candles on the chart. a basing candle is a candle with body length less than 50% o...
basing candlesticks metatrader indicator— is an automatic indicator that detects and marks basing candles on the chart. a basing candle is a candle with body length less than 50% o...
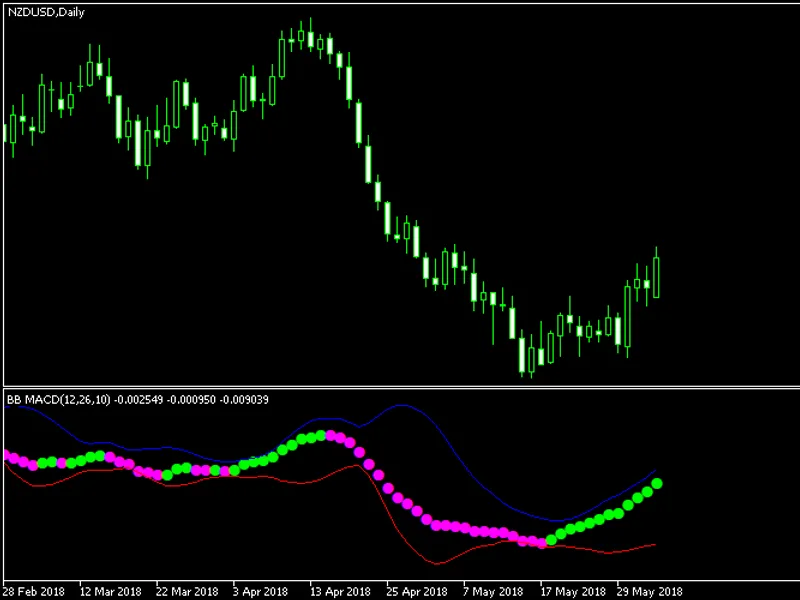
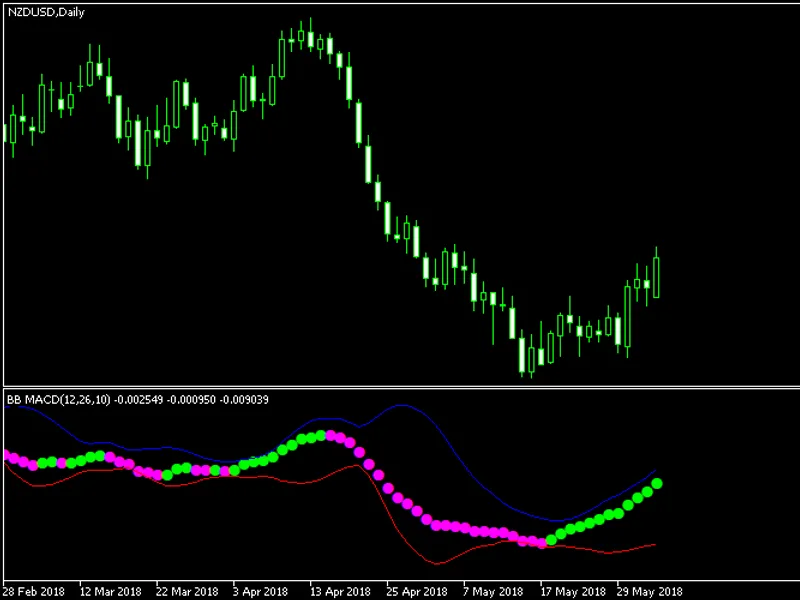
bb macd metatrader indicator— is a basic macd (moving average convergence divergence) indicator variation, which helps in detecting the trend change points and measuring the curren...
bb macd metatrader indicator— is a basic macd (moving average convergence divergence) indicator variation, which helps in detecting the trend change points and measuring the curren...
input parameters allbars(default = 0) — the amount of bars to use for calculations (0 — all bars). there is no reason to change it.otstup(default = 30) — the number of percents tha...
input parameters allbars(default = 0) — the amount of bars to use for calculations (0 — all bars). there is no reason to change it.otstup(default = 30) — the number of percents tha...
bma metatrader indicatoror band moving average — was created by using the original moving average indicator and the idea from one of the site's visitors. the indicator displays its...
bma metatrader indicatoror band moving average — was created by using the original moving average indicator and the idea from one of the site's visitors. the indicator displays its...
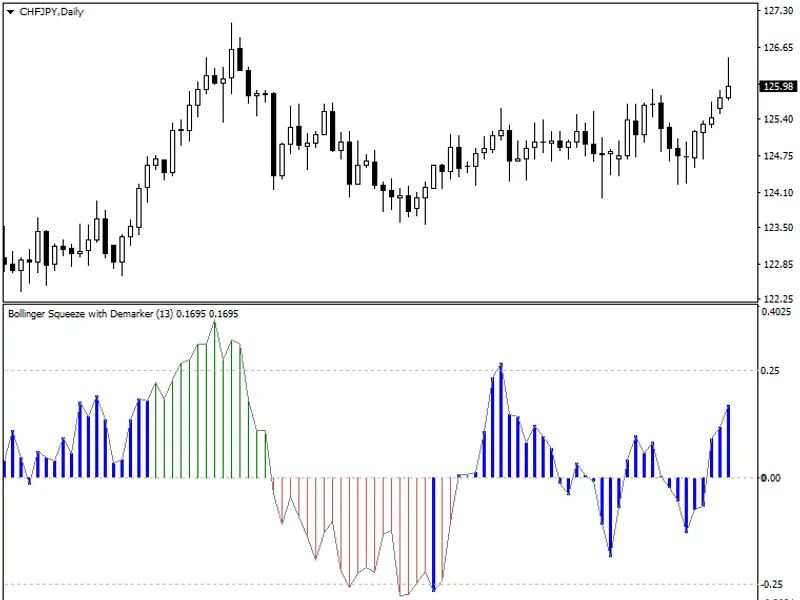
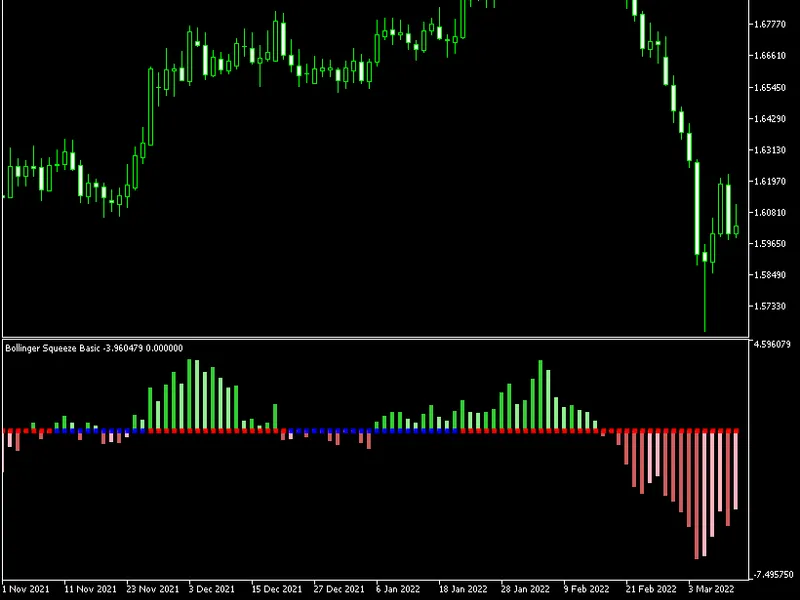
bollinger squeeze advanced metatrader indicator— is a complex indicator consisting of two components:a measure of trendedness based on the bollinger bands and keltner channel "sque...
bollinger squeeze advanced metatrader indicator— is a complex indicator consisting of two components:a measure of trendedness based on the bollinger bands and keltner channel "sque...
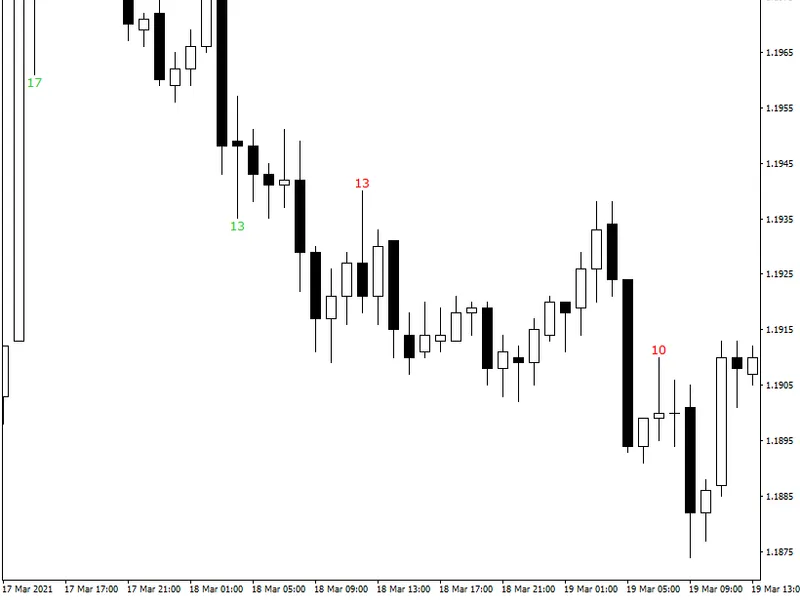
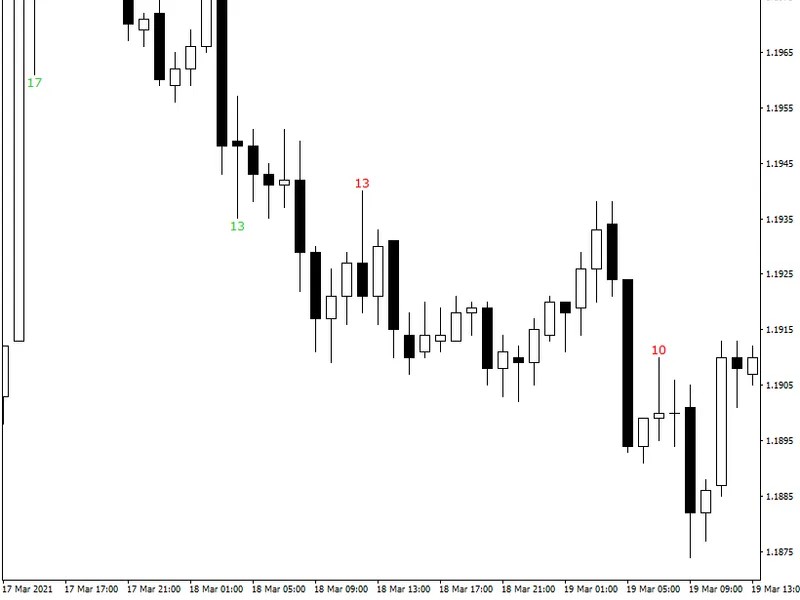
candle wicks length display metatrader indicatoris an indicator that can display the length of candle wicks in pips directly on your chart. you can set the minimum length to be dis...
candle wicks length display metatrader indicatoris an indicator that can display the length of candle wicks in pips directly on your chart. you can set the minimum length to be dis...
input parameters cci_period(default = 14) — the period of the cci that is used in this indicator. the higher is the value the more lags this indicator but less false signals occur....
input parameters cci_period(default = 14) — the period of the cci that is used in this indicator. the higher is the value the more lags this indicator but less false signals occur....
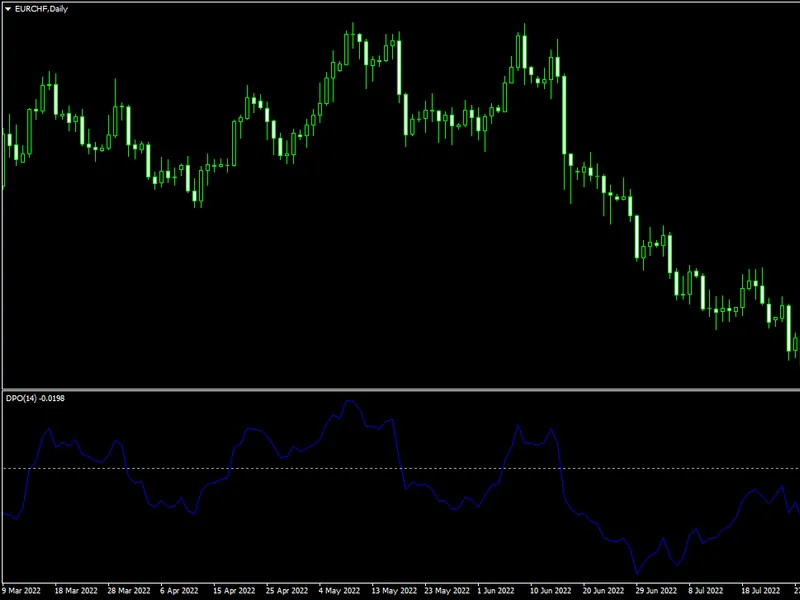
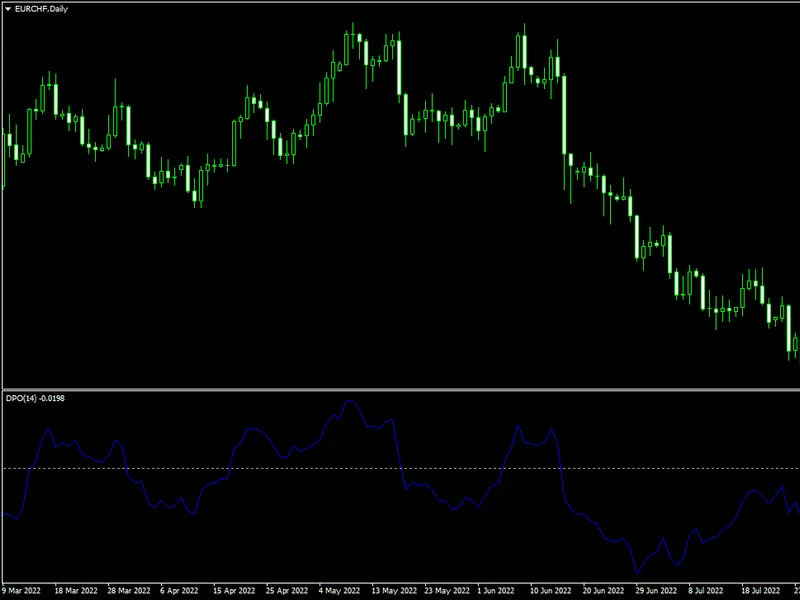
input parameters roc1period(default = 14) — the period of the first rate of change in the sum.roc2period(default = 11) — the period of the second rate of change in the sum.maperiod...
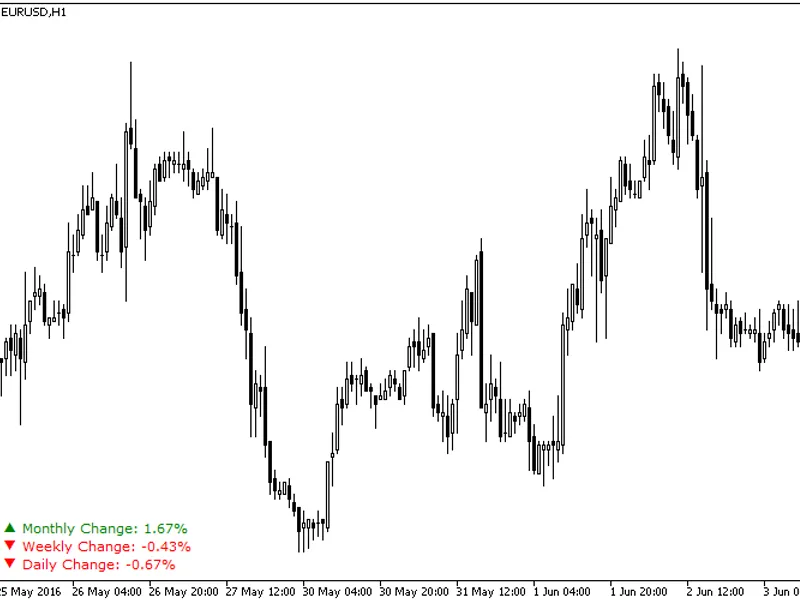
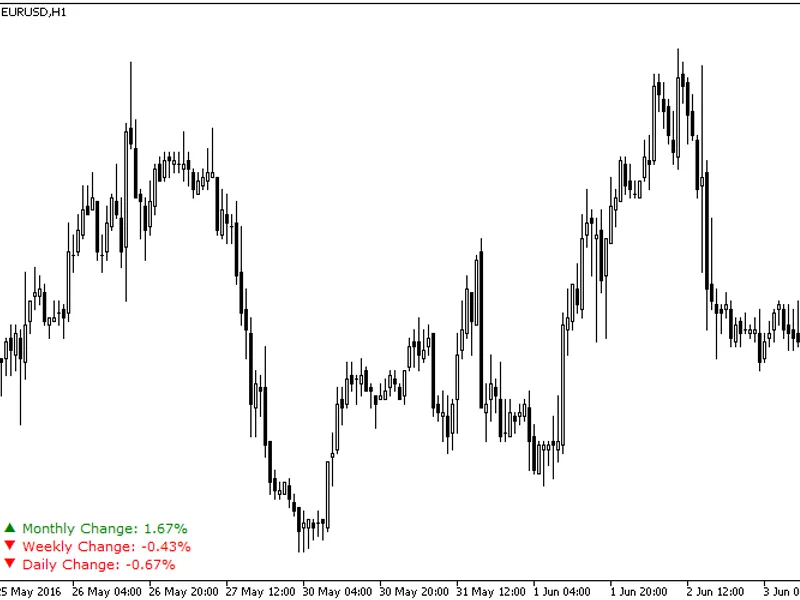
daily percentage change (metatrader indicator)— calculates the change of currency rate related to the previous daily close and displays it in percentage points in the main chart wi...
input parameters ma_period(default = 14) — the period of the simple moving average used in the indicator.barstocount(default = 400) — for how many bars to calculate the indicator.e...
input parameters ma_period(default = 14) — the period of the simple moving average used in the indicator.barstocount(default = 400) — for how many bars to calculate the indicator.e...
daily percentage change (metatrader indicator)— calculates the change of currency rate related to the previous daily close and displays it in percentage points in the main chart wi...
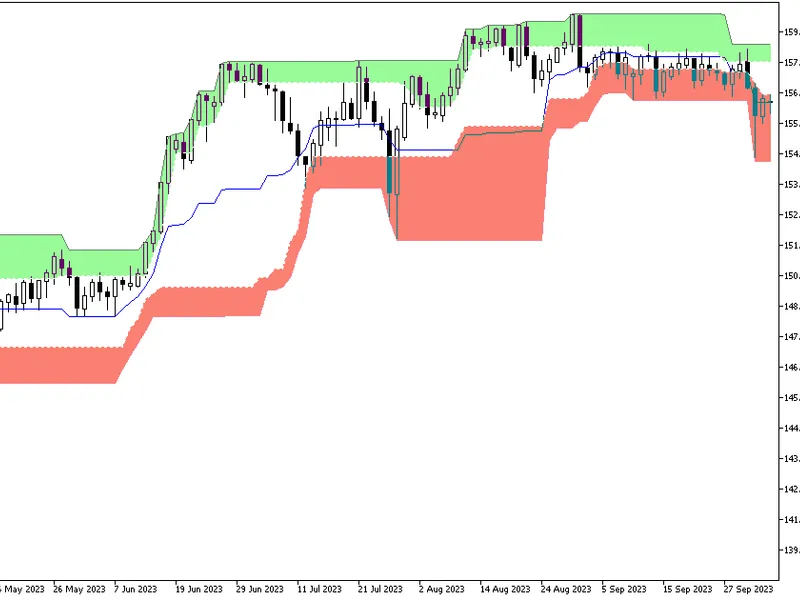
donchian ultimate metatrader indicator— is a classic donchian channel indicator with multiple features added:variable period and shift of the donchian channel. the middle line that...