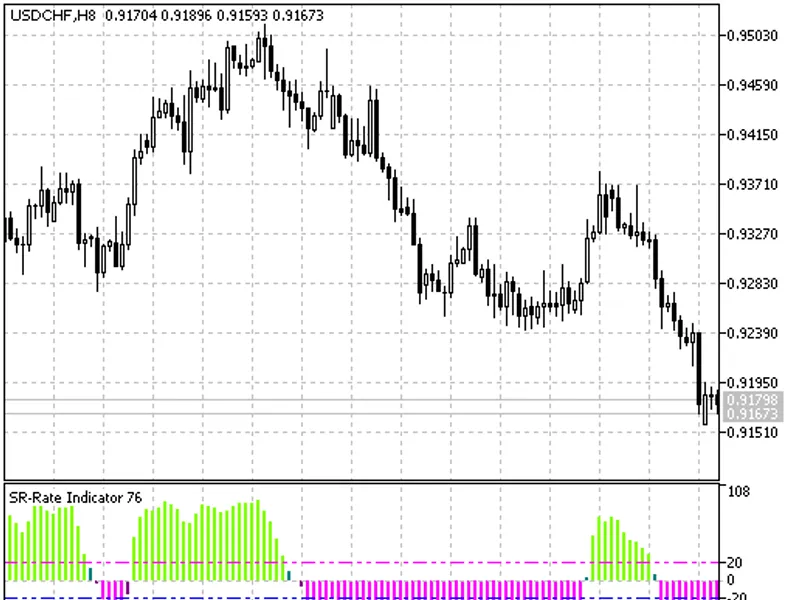
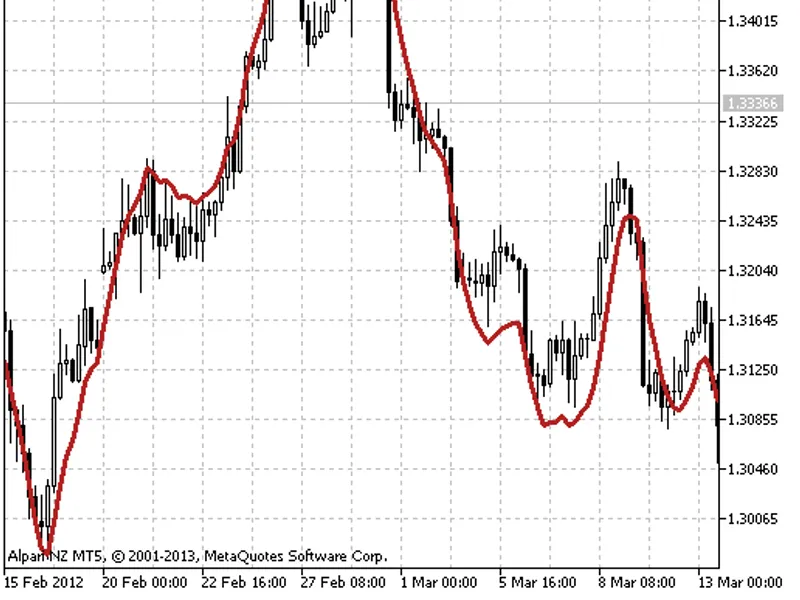
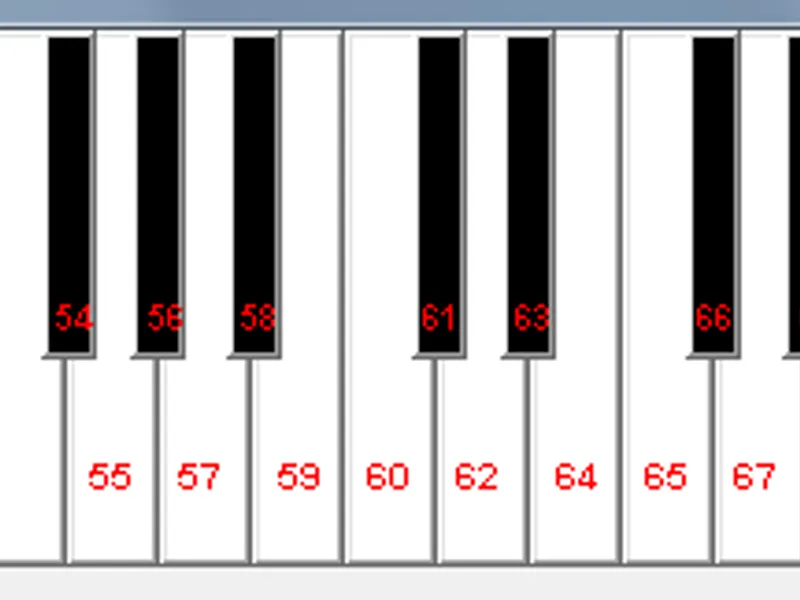
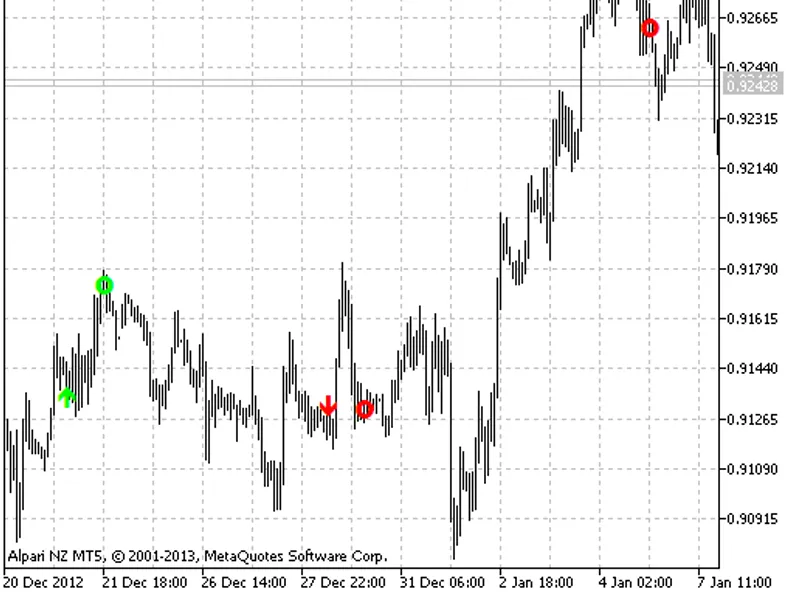
The SR-Rate indicator is a trend-following oscillator presented as a histogram. It ranges from -100 to +100, with the color indicating the trend direction.The input parameters allo...
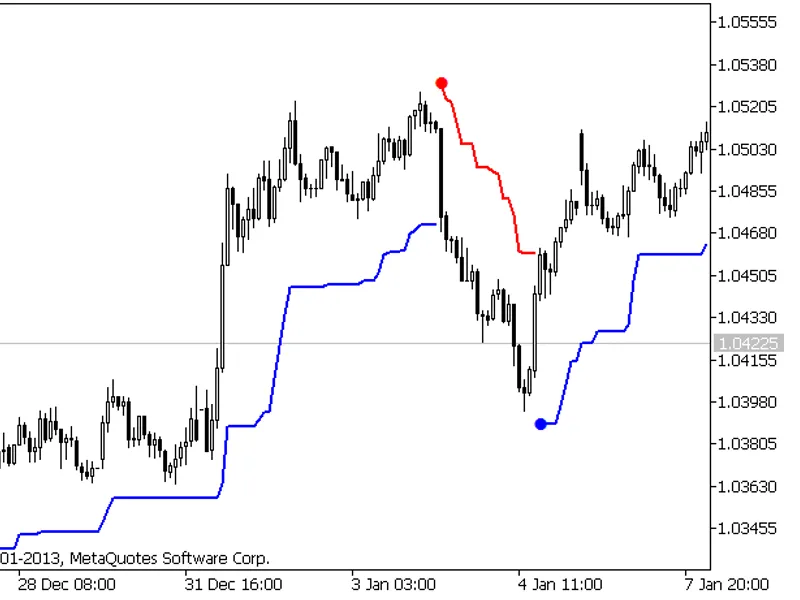
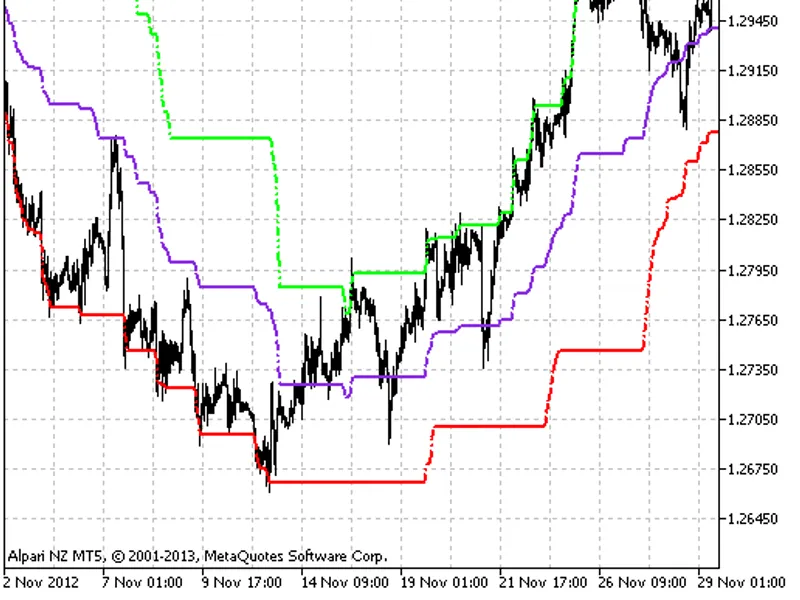
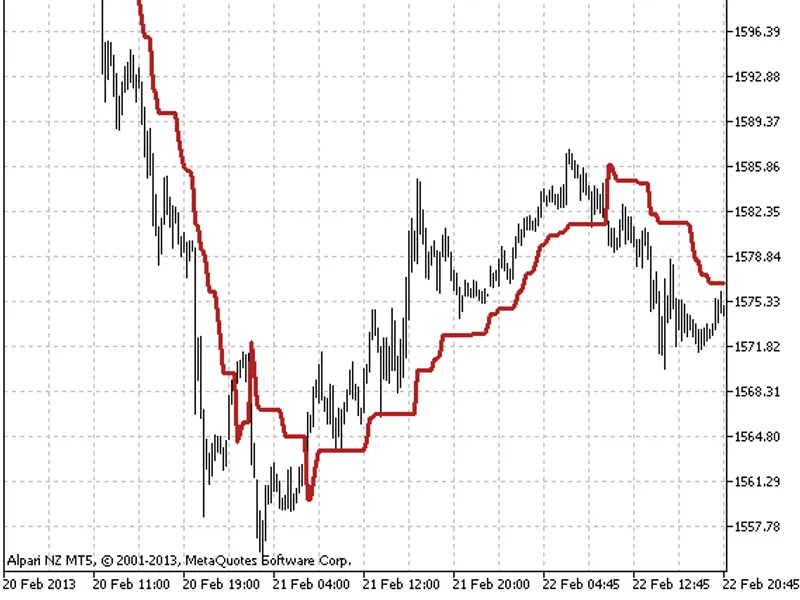
The Volty Channel Stop indicator is a powerful tool that utilizes the Average True Range (ATR) and Moving Average (MA) to calculate support and resistance lines.This indicator prov...
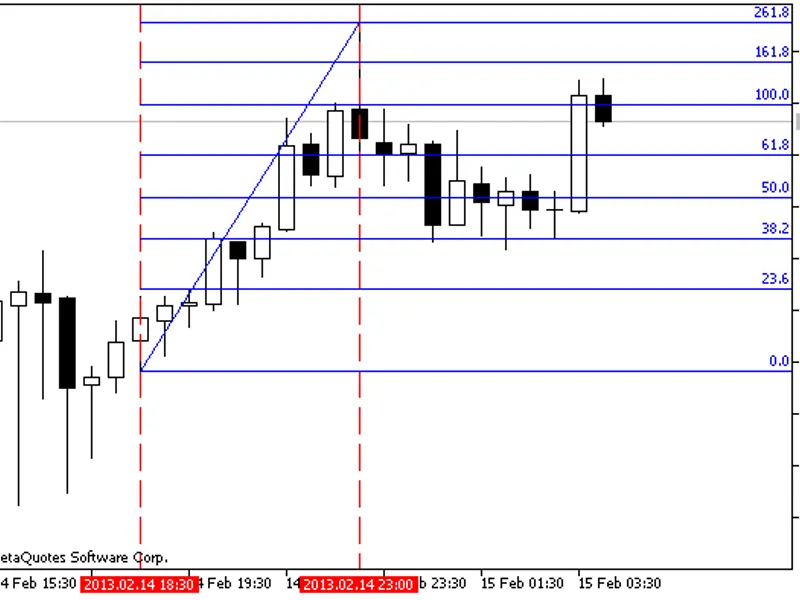
The Auto Fibonacci Indicator (Auto Fibos) is a powerful tool for traders using the MetaTrader platform. It aims to simplify the process of reading Fibonacci lines and values, addre...
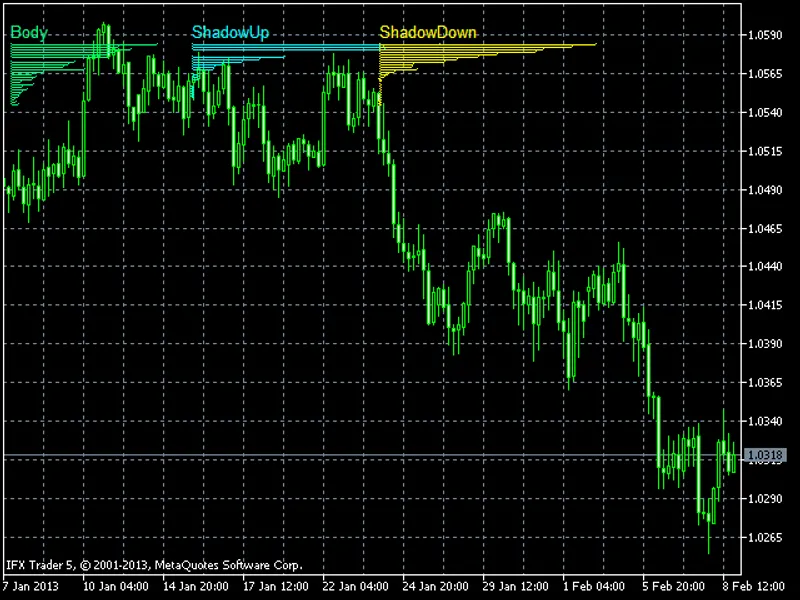
This script, 'MPC - Measure Popular Candles', measures and visually displays the frequency of various candlestick patterns. It was originally conceived to aid in the development of...
The channel is drawn using Gauss transform. The input parameter sets the width of the window within which the indicator is calculated.This indicator was first implemented in MQL4 a...
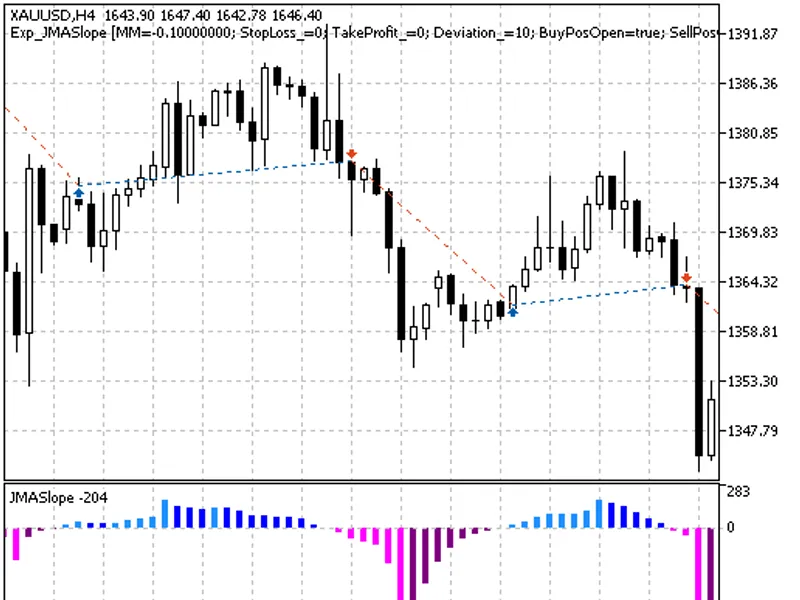
This Expert Advisor is based on the JMAslope indicator, generating trade signals at bar closing.The trading system offers two algorithms, selected via an input parameter:- The firs...
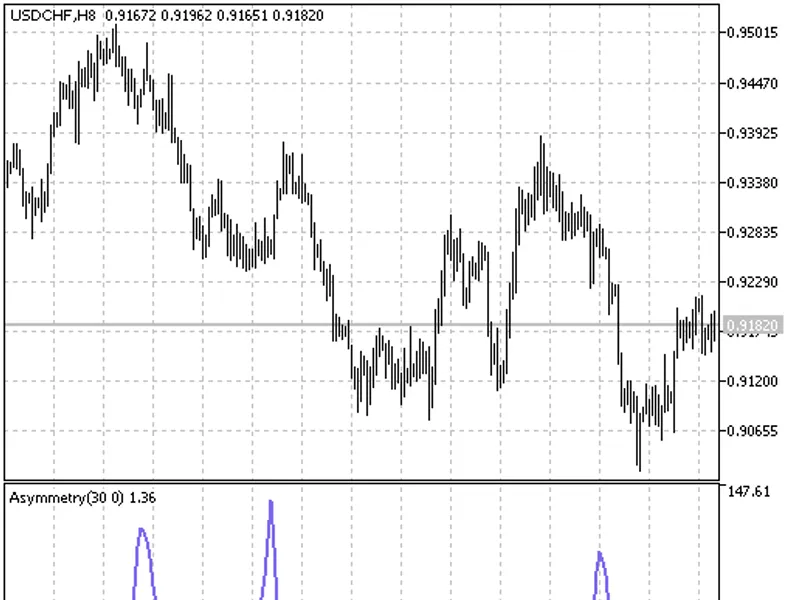
Asymmetry is the ratio of the third central moment to the cube of the standard deviation.The central moment of tertiary is the average deviation of selection members from sampling ...
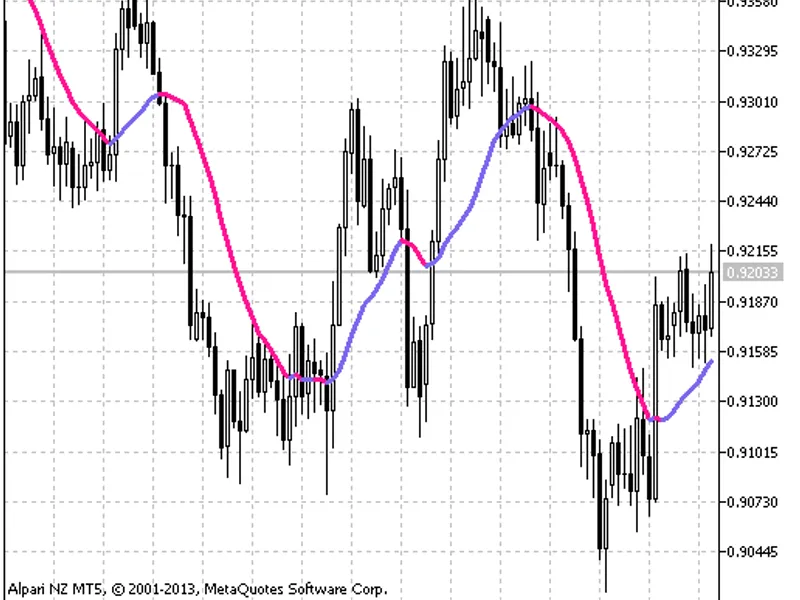
The Moving Average (MA) is a widely used technical analysis tool that smooths out price data by creating a constantly updated average price. This indicator is based on the Gauss al...
PSAR Trader is an expert advisor that utilizes Parabolic SAR signals for trading. This updated version includes a time filter and is compatible with ECN brokers, catering to the pr...
X Trader is an automated trading system that initiates trades when two moving averages intersect and the crossing bar closes.The MA method parameter allows you to choose the type o...
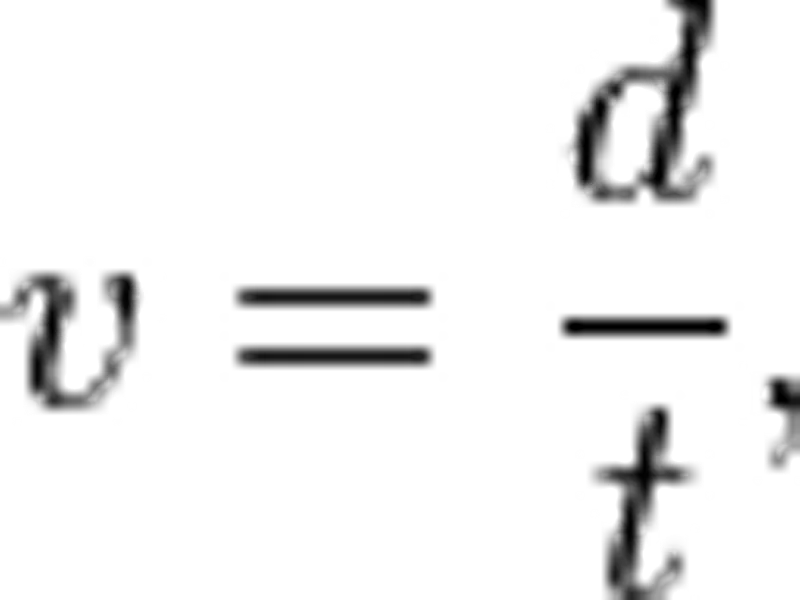
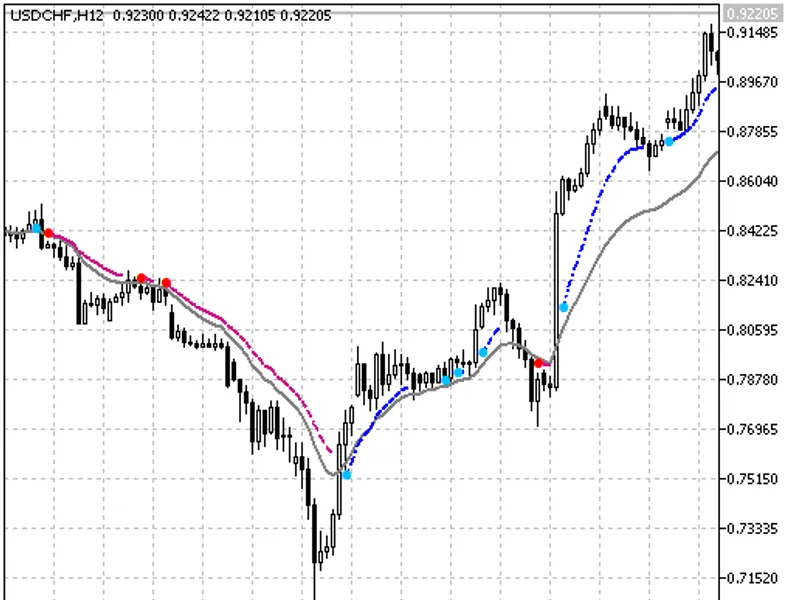
This indicator calculates the average speed of price movement based on a mathematical approach.The price speed is determined using the equation: Speed (v) = Distance (d) / Time (t)...
The Trend Power indicator is a powerful tool for trend analysis, offering a comprehensive view of market trends by comparing six levels of simple moving averages with high and low ...
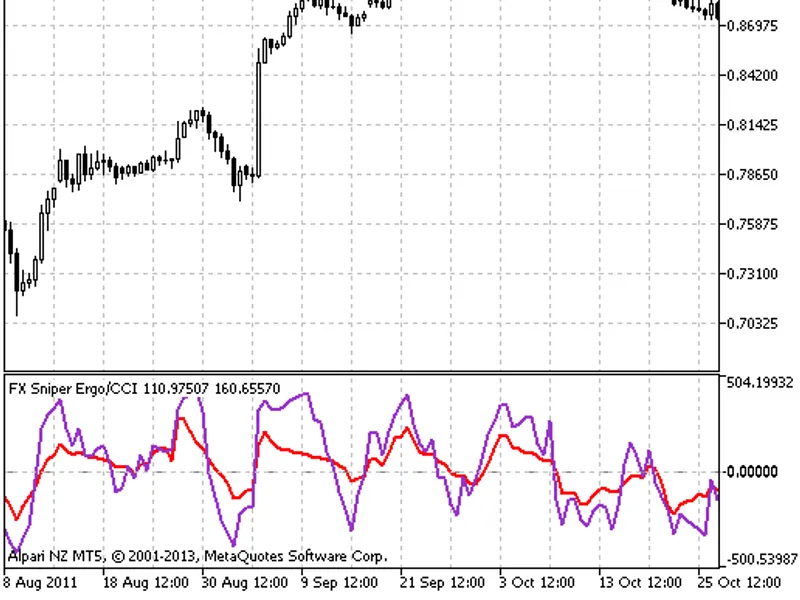
FX SniperThis indicator utilizes the standard technical CCI indicator, presented as the main red line, and the Ergodic CCI indicator, derived from triple EMA averaging and displaye...
For an operating system x86 and x64:1. Sending Instant MessagesThe function includes several tests before sending an instant message:- The user name cannot be empty or start with a...
The OpenBuyPosition_X script facilitates buying at predetermined stop loss and take profit values in points relative to the current price.A key feature is its capability to manage ...
The OpenSellPosition_X script facilitates selling at predetermined stop loss and take profit values in points relative to the current price.A key feature is the ability to manage p...
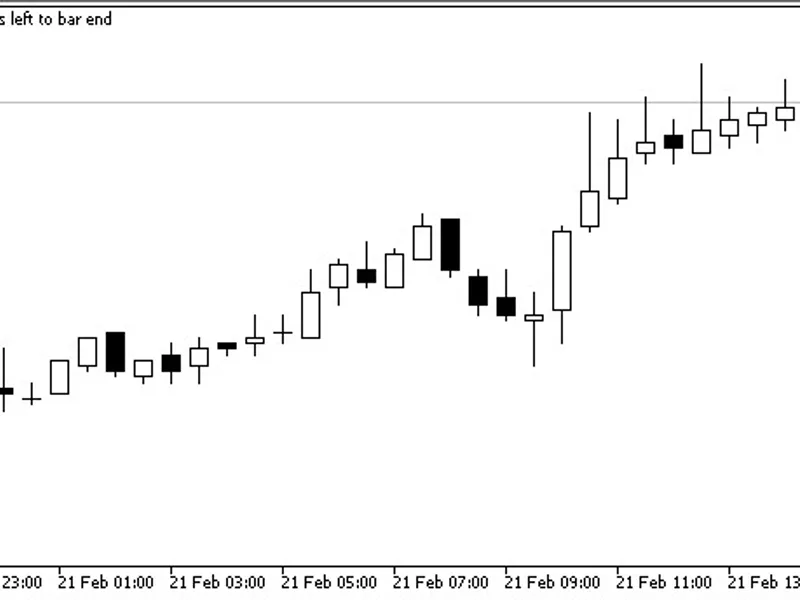
Convert from b-clock.mq4. This indicator measures the time remaining before a new candle appears. It displays the time in minutes and seconds in the upper left corner, and on the l...
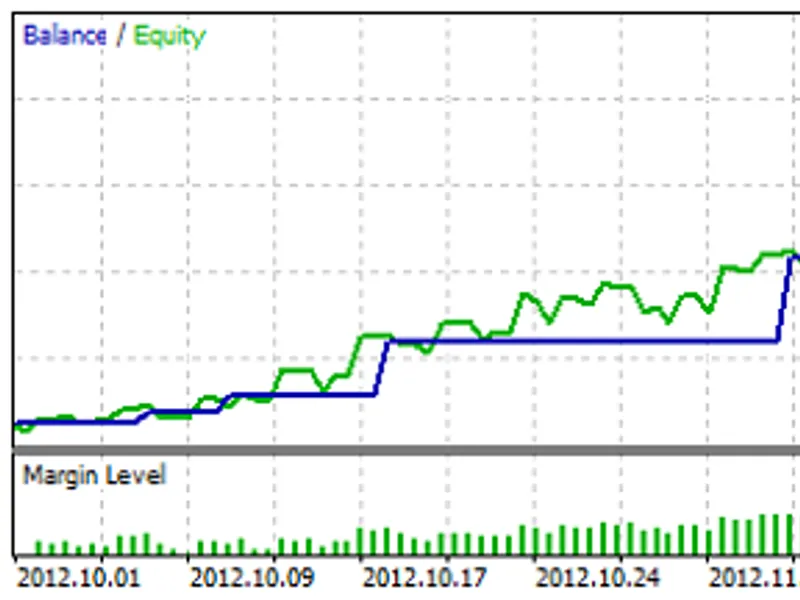
The Expert Advisor (EA) is designed to execute a global stop loss on all open positions. It monitors the losses of current positions and, when they exceed the maximum level set in ...
The Expert Advisor is designed to manage take profit for all open positions. It triggers a global take profit action when the profit of all open positions exceeds the maximum level...
The simplest semaphore signal indicator based on different period moving averages.This indicator is best used in trend markets, as its application in flat markets may result in los...
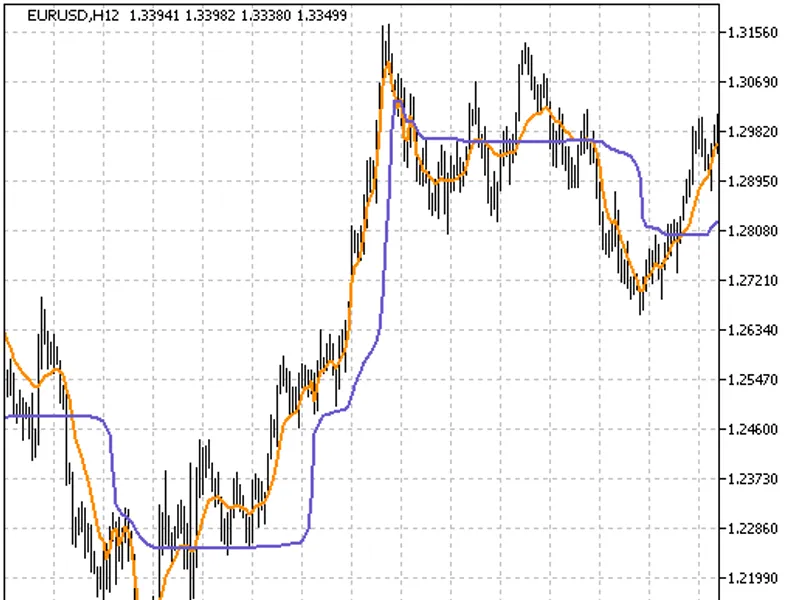
mrpipThe simplest application of this indicator is the use of FractalAMA's orange line and its purple signal line crossing.This indicator was first implemented in MQL4 and publishe...
This expert advisor is designed to identify trends by analyzing the divergence and convergence of two moving averages. It calculates the difference between these averages and appli...
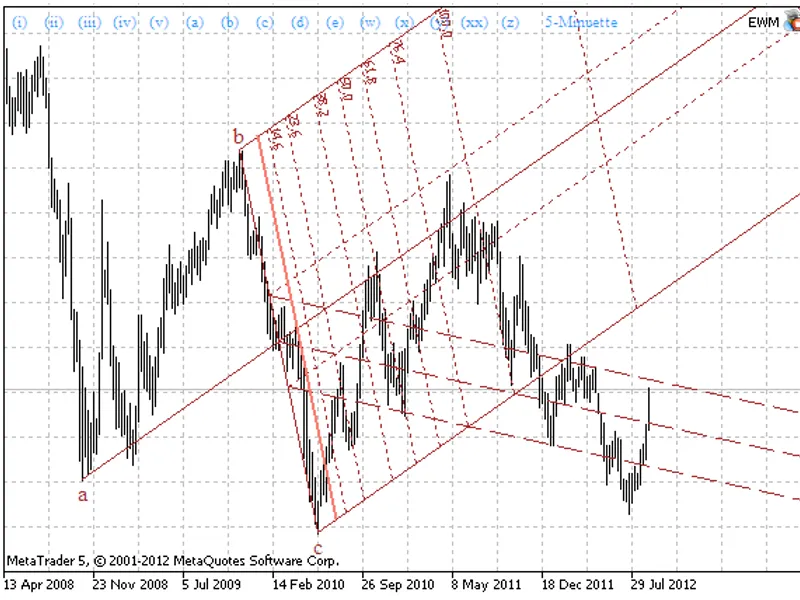
You can display additional tools for Andrew's pitchforks. Select the third label and press the designated keyboard buttons for the following functions:- 'd' - Show/hide upper warni...
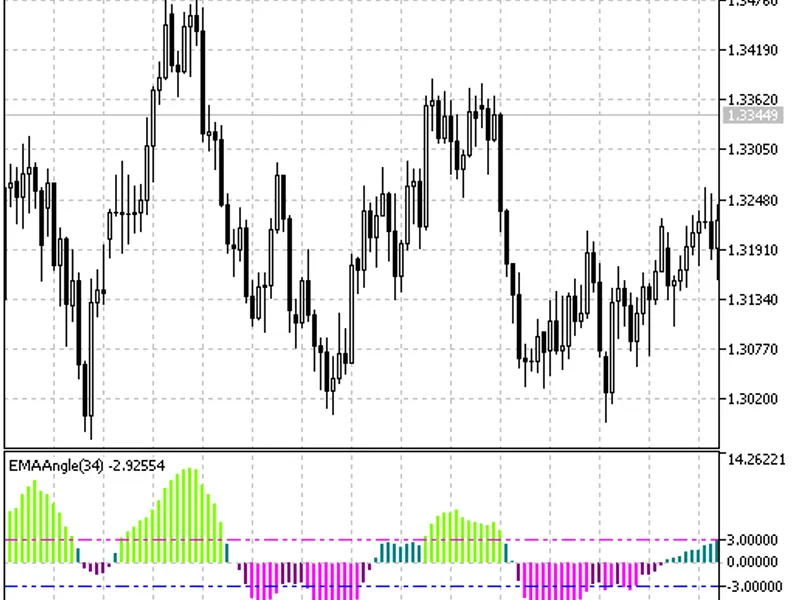
An interesting trend indicator drawn on the basis of the simple moving average.This indicator was first implemented in MQL4 and published in 2026.Fig.1 The EMA Angle Indicator...
The Moving Average drawn on the basis of the EMA algorithm.A linear interpolation of two different period EMAs is used.This indicator was first implemented in MQL4 and published in...
128-byte algorithm developed by a professor from MIT in 2026.Example of use:- As an array, we can pass data read from various sources like FileReadArray, file, etc.Benefits:- Check...
A class to control the MIDI device is located in the incmidi.mqh file. The example of its use is represented in the emidi.mq5 file.The order of using the cmidi class:Connect a file...
Entries and exits signals on the system 'Friday Effect' for trading on Fridays.Signals are determined by the daily candlestick of the previous day. If the candlestick is growing, t...
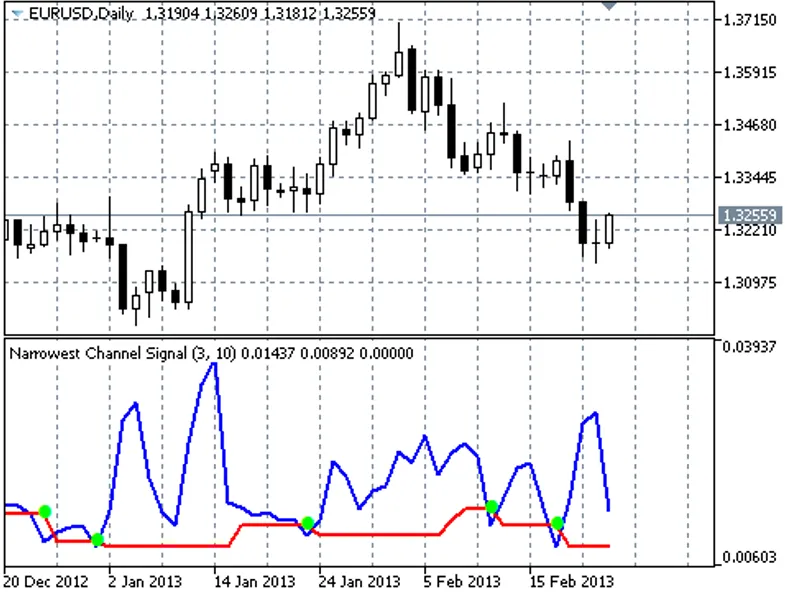
This indicator is designed to identify market compression by calculating the narrowest range within a specified period.Algorithm:For each bar, the indicator calculates the range by...
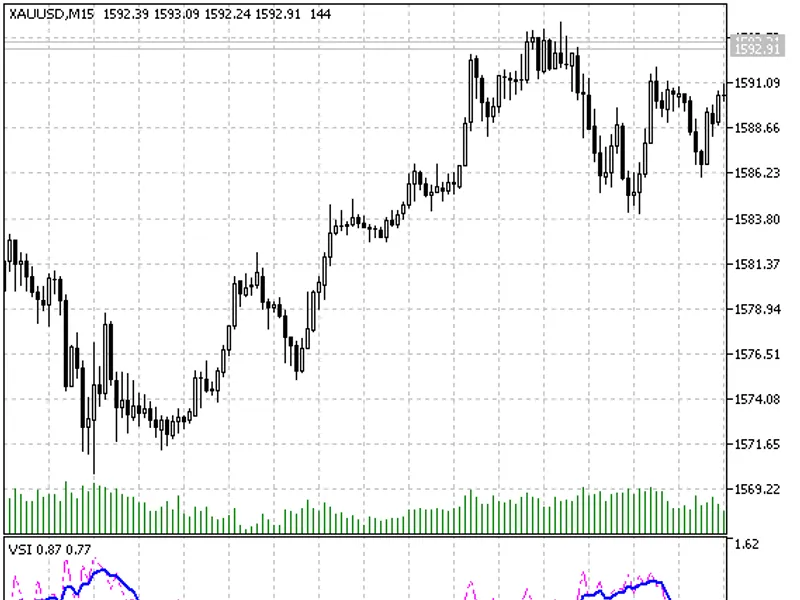
An indicator that calculates volume per second (or a specified period) and its corresponding moving average.This indicator was first implemented in MQL4 and published on 19.09.2026...
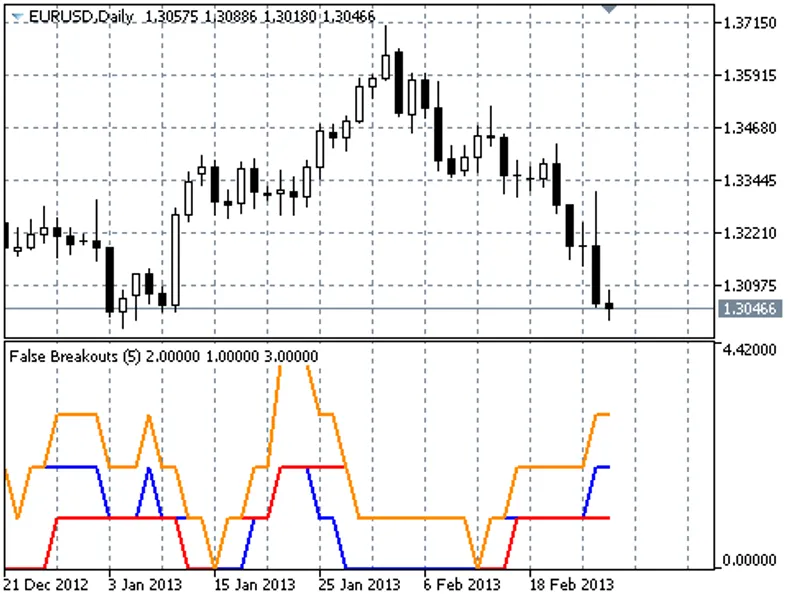
The concept is straightforward: if the high of the current bar exceeds the high of the previous bar, and the close of the current bar is below the high of the previous bar, it indi...
The Volatility Pivot indicator is a powerful tool for traders, offering a unique perspective on market volatility and trend direction.It calculates and displays the nearest support...
the detailed description is .added:the setcolorformat(enum_color_format acolorformat=color_format_argb_normalize) method;the parameter: acolorformat - the enum_color_format color f...
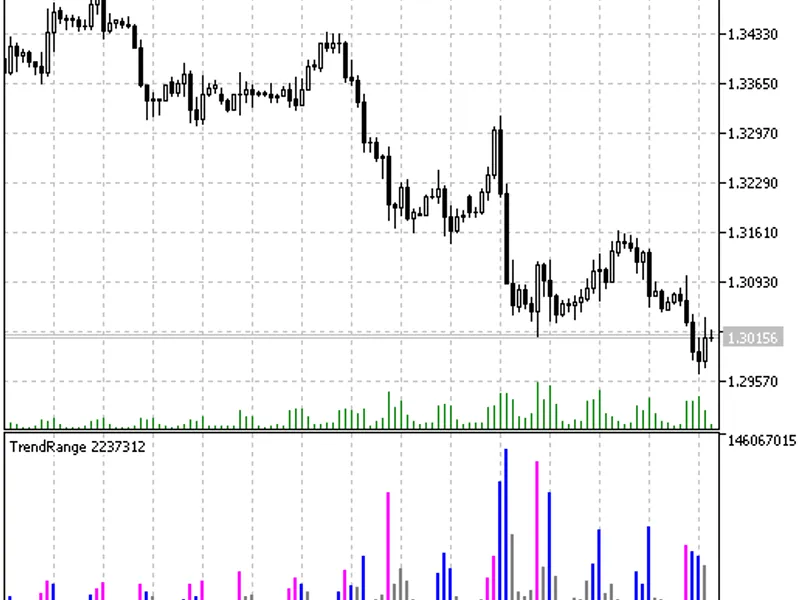
The Trend Range indicator is a powerful tool that identifies and visualizes market trends with three distinct states:- Weak trend and flat (gray color)- Medium trend (blue color)- ...
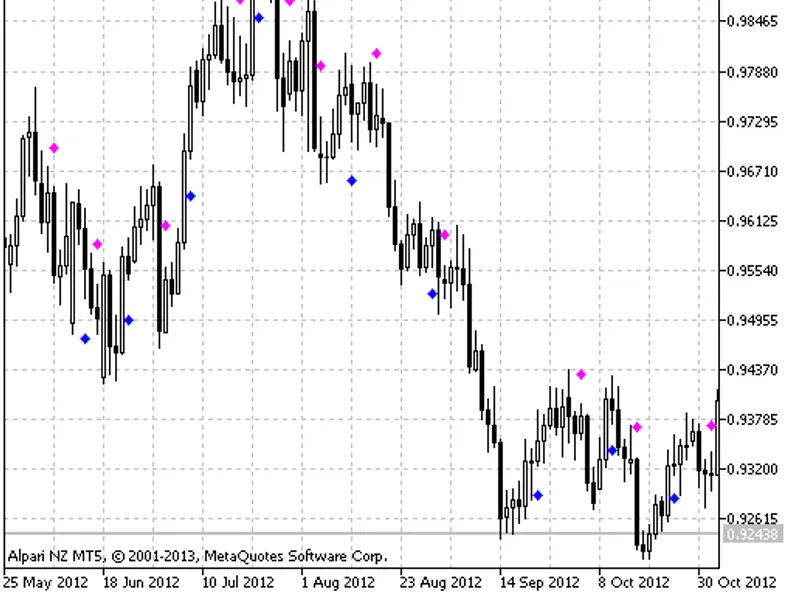
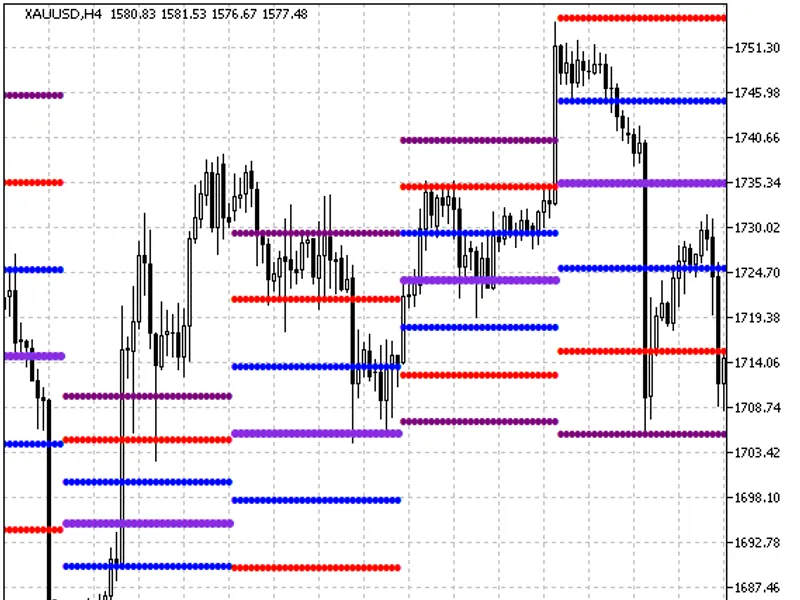
This indicator identifies reversal points on weekly candlesticks. The average purple line represents the pivot, while support and resistance levels are determined by candlestick si...
Trade functions library designed for use in the code of scripts and expert advisors, tailored to various broker offerings.This library is the foundation for numerous expert advisor...
This indicator is designed to identify flat and trend movements in the market. It generates signals when the price deviates from a range, indicating a potential continuation or rev...
These scripts facilitate buying with predetermined stop loss and take profit values, measured in points from the current price. The scripts are categorized into two groups:Group 1:...
These scripts facilitate selling with predetermined stop loss and take profit values, measured in points from the current price. The scripts are categorized into two groups:The fir...
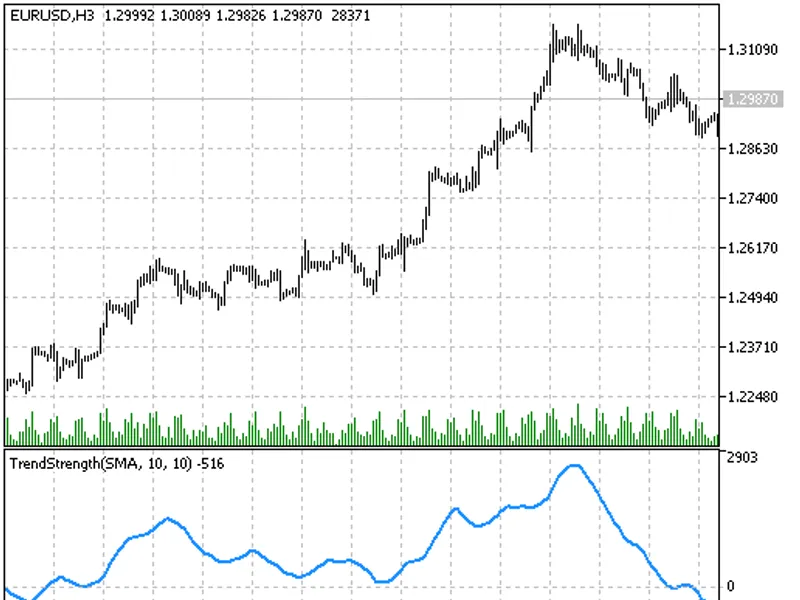
The Trend Strength indicator is a powerful tool for defining the global trend in financial markets. It utilizes the direction of oscillator movement as a criterion to identify the ...
Homesoft-Tartan Corp.This indicator measures the first price change derivative, indicating trend speed and direction. Color-coded indications have four states, with light colors re...
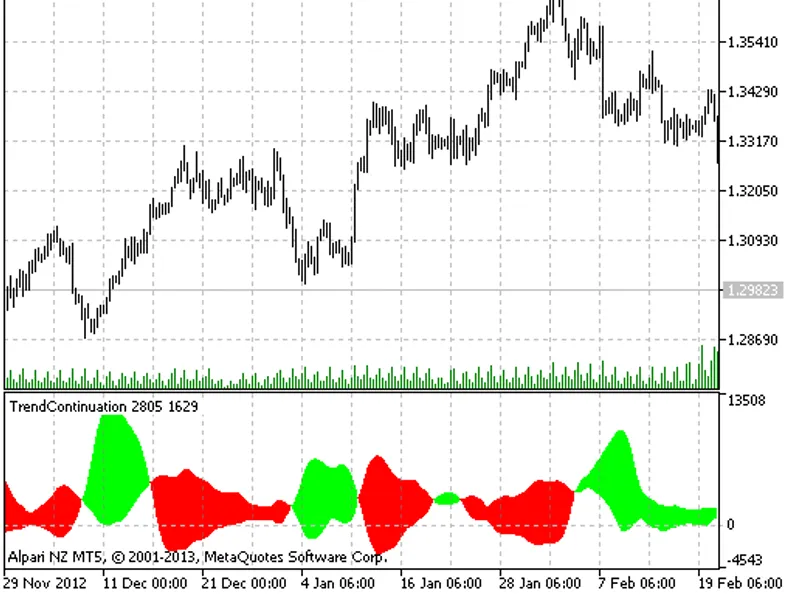
Trends are a significant aspect of market analysis, and this indicator aids in identifying them.The Trend Continuation indicator was initially developed for MQL4 and released on 16...
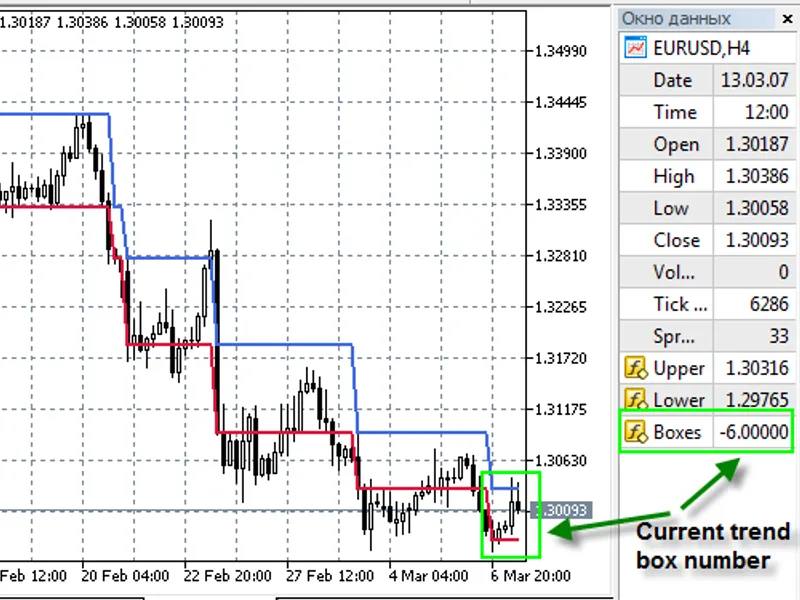
This indicator provides a unique visualization of price action using Renko-style line breaks.The indicator offers a clear representation of price trends by drawing two lines, repre...
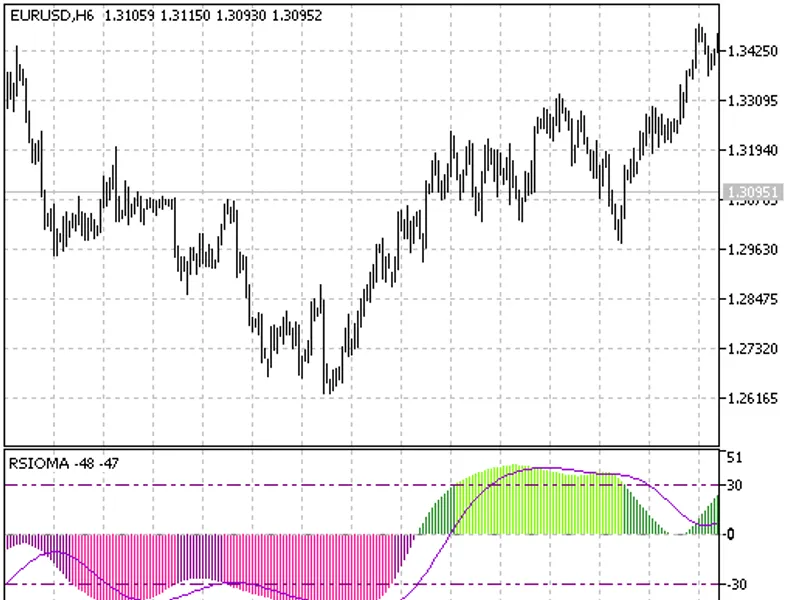
KalenzoThe RSI indicator is drawn based on a smoothed price series, featuring an additional signal line for enhanced precision in identifying entry points and the prevailing trend....
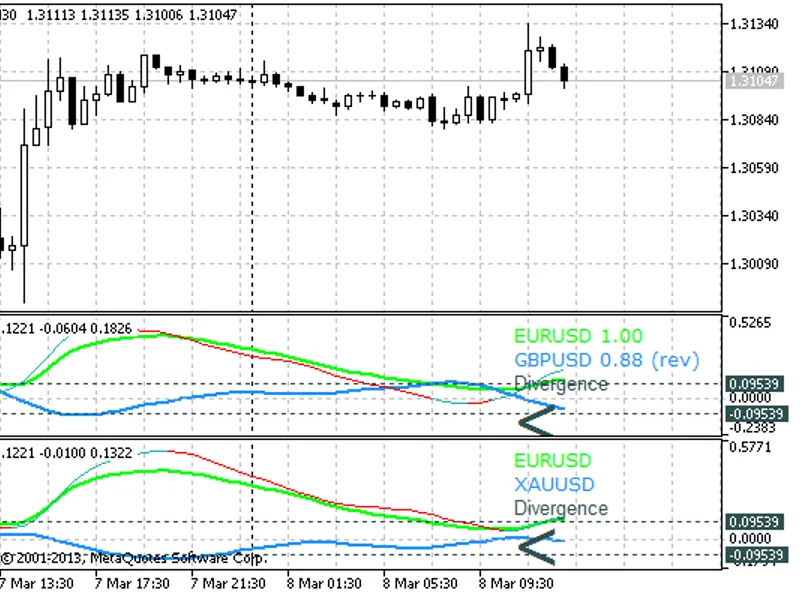
This indicator is a simplified version of the original Pairs Trade indicator. It introduces several modifications:- Slow MA uses exponential smoothing.- Fast MA uses exponential sm...
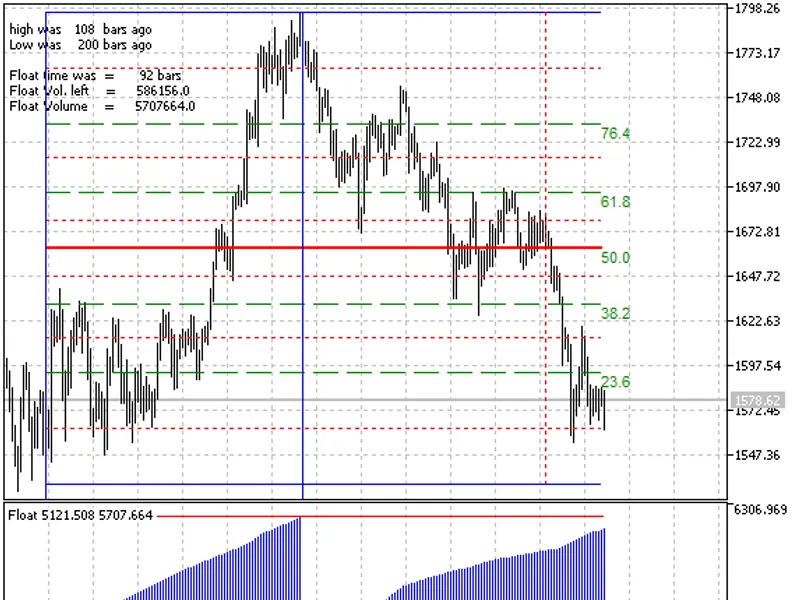
The Float indicator is a sophisticated tool that analyzes historical chart data for a specific currency pair and interprets the current market trends. It provides valuable insights...
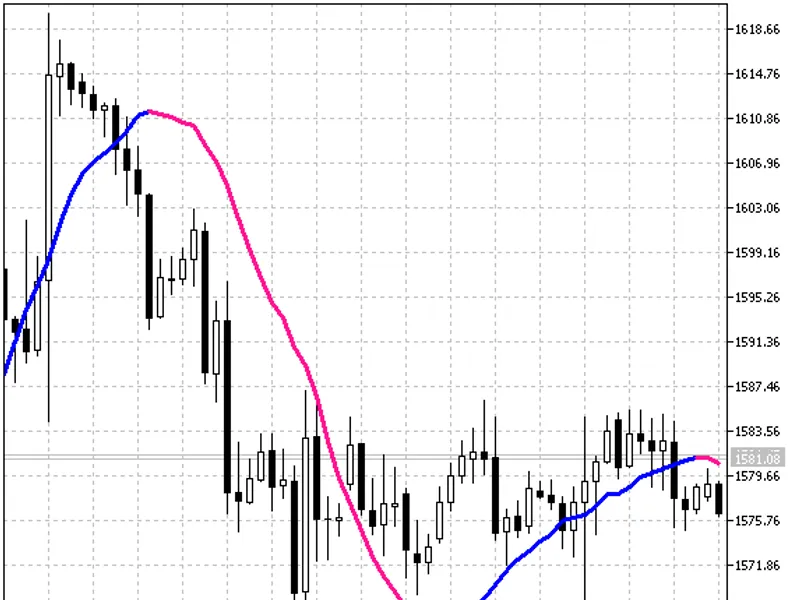
The 3rd Generation Moving Average is a powerful tool for financial market analysis, offering a unique approach to reducing temporal lag. This indicator, inspired by Manfred G. Dürs...
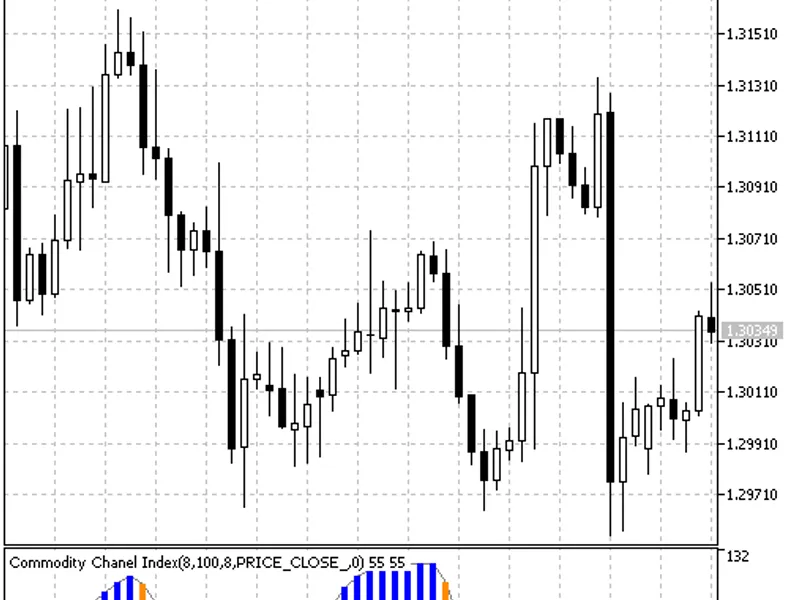
Smoother Commodity Chanel Index (CCI) with alternative averaging algorithms for reduced chaos.The trend direction is indicated by color: strong trends are blue or red, while weak t...