Pairs Trade Light
This software component for MetaTrader 5 is built to enhance the capabilities of your trading environment. This technical indicator acts as a specialized analysis tool designed to visualize market data. It helps traders identify emerging trends, momentum shifts, and key support or resistance levels by plotting statistical calculations directly onto price charts.
How to Setup and Use Pairs Trade Light
1. Installation: Place your file in the MQL/Indicators folder via "Open Data Folder" and restart your terminal.
2. Loading: Find the indicator in the Navigator, drag it onto your chart, and configure the input parameters in the popup window.
3. Customization: Press Ctrl+I to open the indicator list, select your tool, and click "Properties" to change colors, levels, or visual styles.
4. Updating: Replace the old file in the Indicators folder with the new version and restart the platform to apply changes.
Frequently Asked Questions
Q: Why is my indicator not showing? A: Verify the file is in the MQL/Indicators folder, or try right-clicking the "Indicators" tree in the Navigator and clicking "Refresh."
Q: Do custom indicators slow down the platform? A: Too many complex indicators can impact performance; remove unused ones via the "Indicator List" (Ctrl+I).
Q: Can I use MT4 indicators on MT5? A: No, MQL4 and MQL5 are distinct languages; ensure the indicator is compiled specifically for your platform version.
Description & Settings
This indicator is the simplified variant of the "" indicator. Unlike it, in this indicator is following:
for slow MA used an exponential smoothing;
for fast MA exponential smoothing is used twice;
ATR is calculated using exponential smoothing;
two threshold lines based on ATR are drawn for the chart of difference;
trading deals volumes are calculated only for "Forex" type instruments;
selected instruments are automatically included in the "Market Watch";
indicator values are calculated not for the whole chart, but the last part which size is defined by "inpNumBars";
a complex system of different symbols data synchronization is not used;
external indicators and include files are not used.
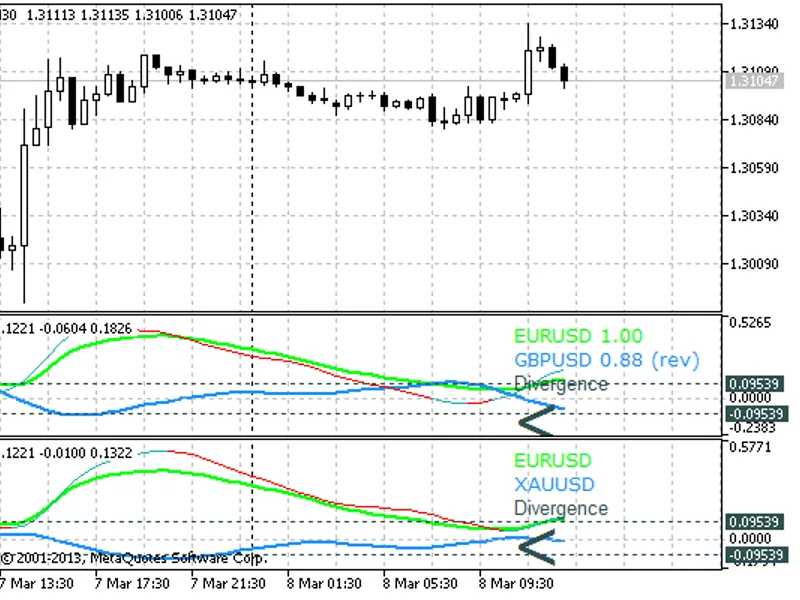
The indicator draws three lines:
green is the price index line of the main instrument;
blue is the price index line of the additional instrument;
two colored line of difference: blue is when there is divergence, red is when convergence.
If you need to continue downloading from the server quotes by the selected instruments or prepare them in the terminal, so the indicator will go to standby, at this the corresponding message is displayed on the screen. Server connection and ticks' arrival will be required for the correct work of the indicator. If there is a connection with the server, but ticks do not come (for example, in weekends), so you can try several times use "Refresh" command of the terminal.
The value of the "Max bar in chart" terminal parameter must exceed the selected value of the "inpNumBars" indicator parameter, in some cases it must significantly exceed it.
Indicator input parameters:
Recommendations:
The indicator hasn't been tested for a long time. It is laid out by the principle "as it is".
Information about such indicator basis and its use can be find, for example, in the archives of the "" magazine or in the forum "".