This script enables the total closure of all positions, including winners and losers. It provides the flexibility to selectively close positions of a specific instrument.A powerful...
This tool instantly removes the stop loss (SL) and take profit (TP) levels from all open positions.It's a quick way to reset your SL/TP settings, allowing you to re-evaluate and ad...
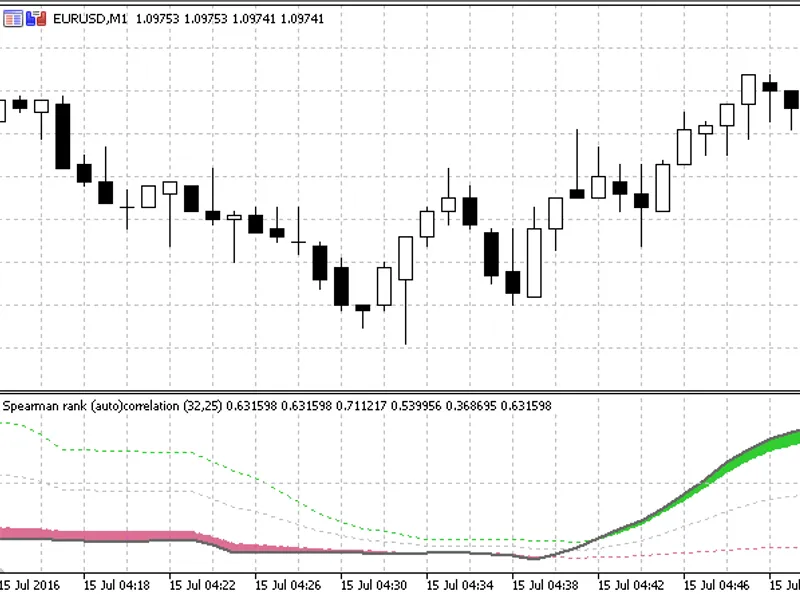
This is a rank (auto)correlation indicator that includes:Spearman Rank CorrelationPearson CorrelationIt offers flexibility with 22 types of prices and allows users to choose betwee...
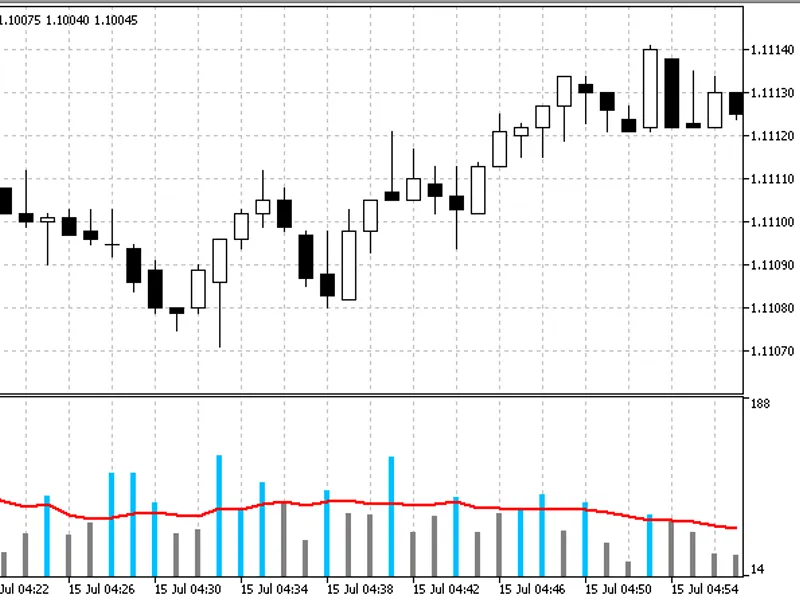
A simple volume indicator with two coloring modes:- Color change on average volume cross(es)- Color change based on the bull/bear state of the corresponding price candleRequires th...
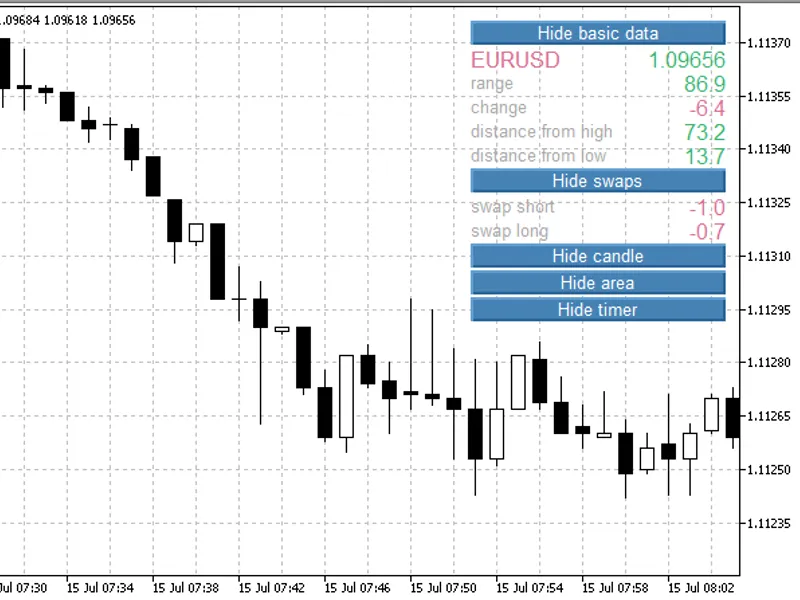
The indicator provides essential information on the current symbol in the chart window. It offers an interactive feature, allowing users to hide or reveal specific data by clicking...
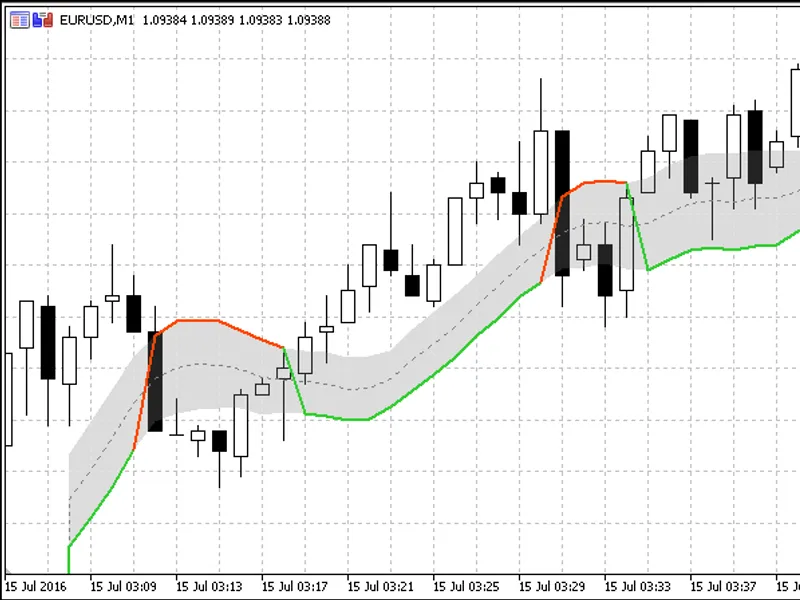
The Gann High Low Activator indicator is a simple moving average (SMA) of the previous N period's highs or lows. It was featured in a 2026 issue of Stocks & Commodities magazine.Th...
The concept behind this indicator is to create a versatile moving average that can adapt and mimic various other moving averages.Key features:- Smoothness: The indicator ensures a ...
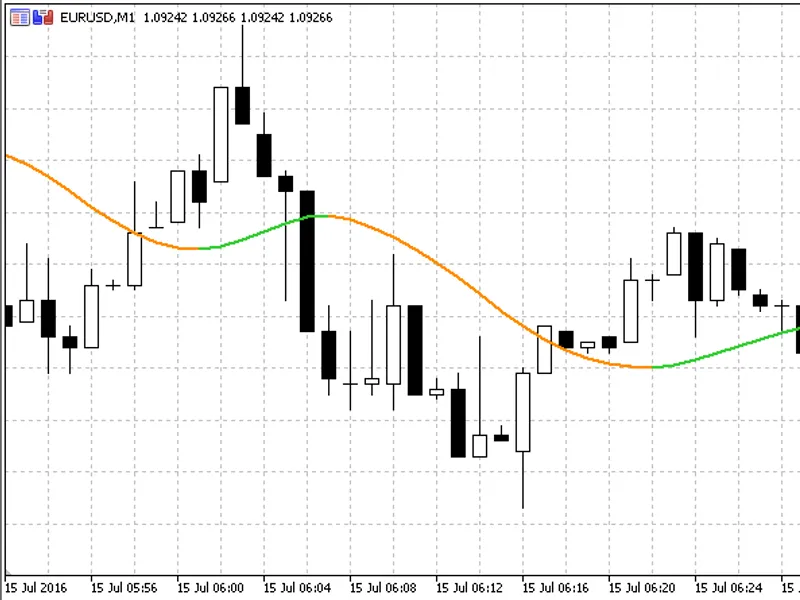
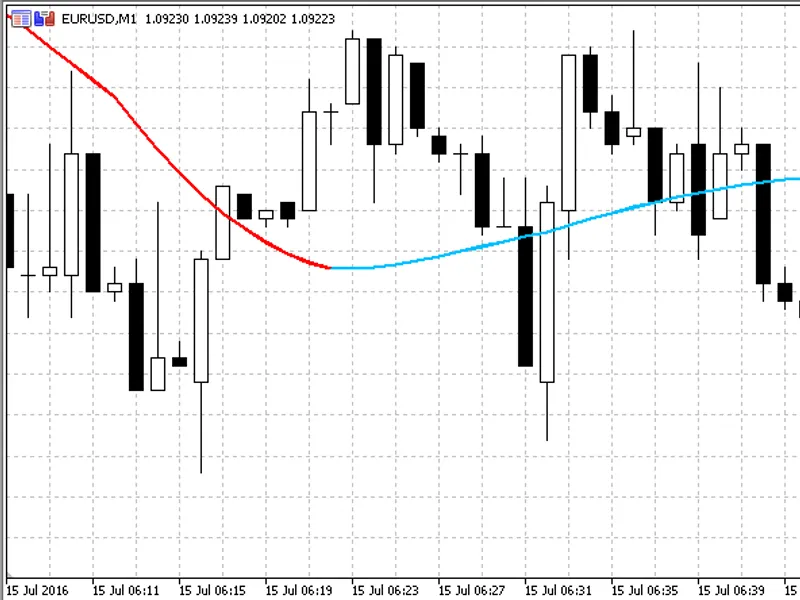
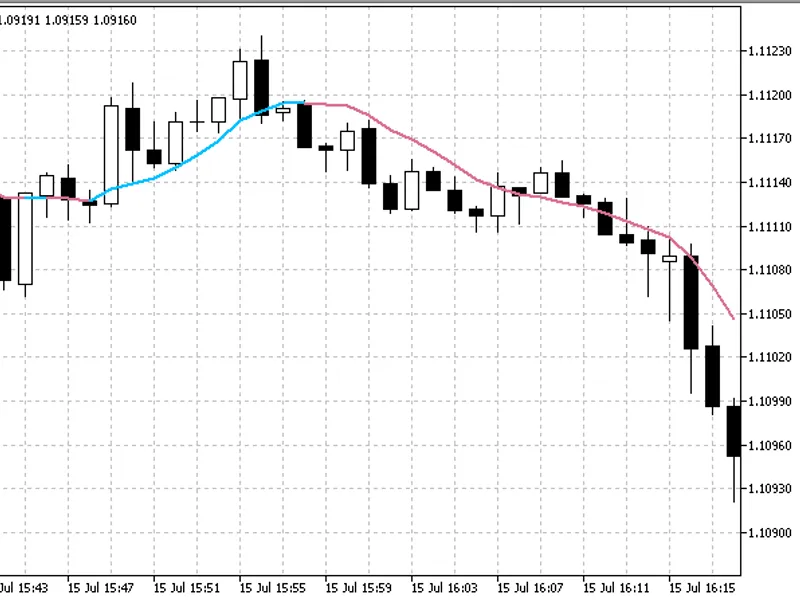
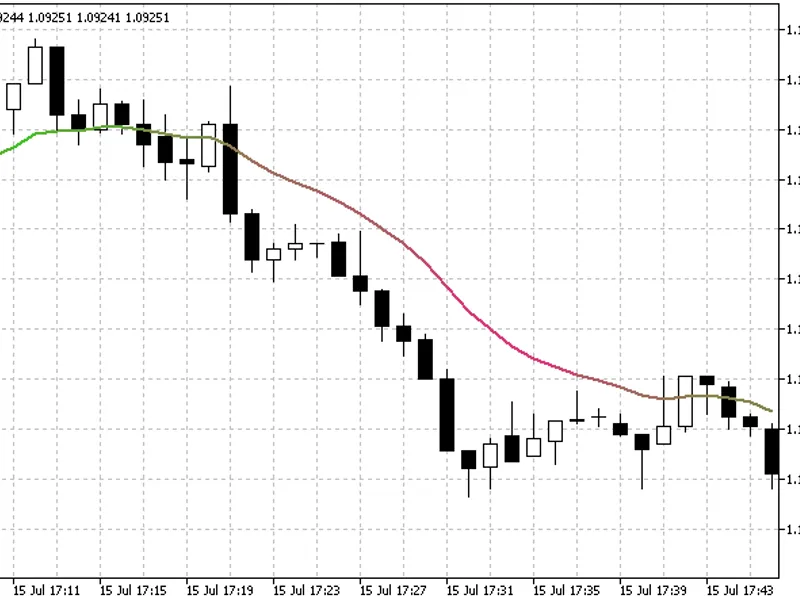
This is an enhanced Jurik Filter with a versatile application range, extending beyond prices to any indicator. The introduction of slope coloring significantly enhances its utility...
This powerful indicator offers a comprehensive set of features tailored for MetaTrader 4/5 platforms.Key Features:- Non-Repainting: Provides accurate, real-time data without lag or...
A unique twist on classical moving averages (MA) with color-coding based on the angle of the slope.The color-coding mechanism:- Steeper angles are closer to or equal to the 'fast u...
This indicator plots arrows to indicate gaps in the market. Up arrows for bullish gaps and down arrows for bearish gaps. It can also plot a cross for a closed gap or hide it.Trader...
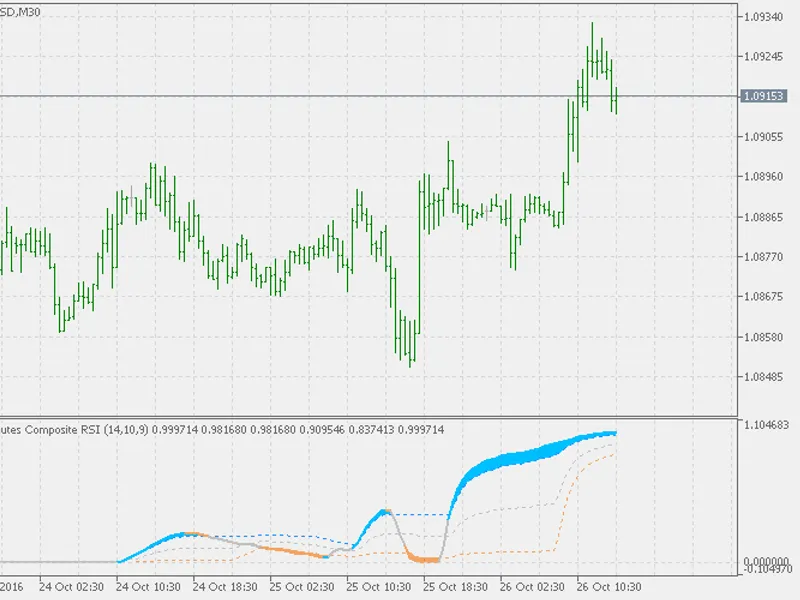
The Composite RSI is a unique indicator that offers a fresh perspective on market analysis.While its name might suggest a combination of multiple RSIs, it is, in fact, a novel appr...
This indicator is based on John Ehlers' work, with a deviation that allows for different calculating periods. The default settings follow Ehlers' original parameters, but customiza...
The script retrieves historical data of PAMM accounts from the Alpari rating and visualizes it on the chart. PAMM accounts are referenced by their unique account numbers. The scrip...
The indicator presents five symbol parameters and two account parameters, some of which may fluctuate during significant news releases or before the weekly session closes.The follo...
The Jupiter M. Grid EA employs a Martingale strategy, which can be deactivated by setting the multiplier to 1, when establishing a grid in both directions.This EA is particularly u...
Every time a stop loss is triggered, the Expert Advisor (EA) adjusts the take profit and stop loss sizes by applying a specified coefficient.This EA is designed to manage stop loss...
The "MasterWindows" article provides a comprehensive guide on designing user-friendly interfaces for your applications. It introduces the MasterWindows class library, which serves ...
Modification of the standard Awesome Oscillator.Recommended timeframe: M15.This version is suitable for capturing small movements (around 100 points) on volatile pairs.The upper in...
The Trade Panel is a versatile tool for both manual and automated trading, showcasing the capabilities of the library. The panel's code is generated using a visual design environme...
This indicator calculates and displays options levels on the chart.Download the CME bulletin:- СМЕ bulletin- ftp://ftp.cme.com/bulletin/Input the required parameters and view the o...
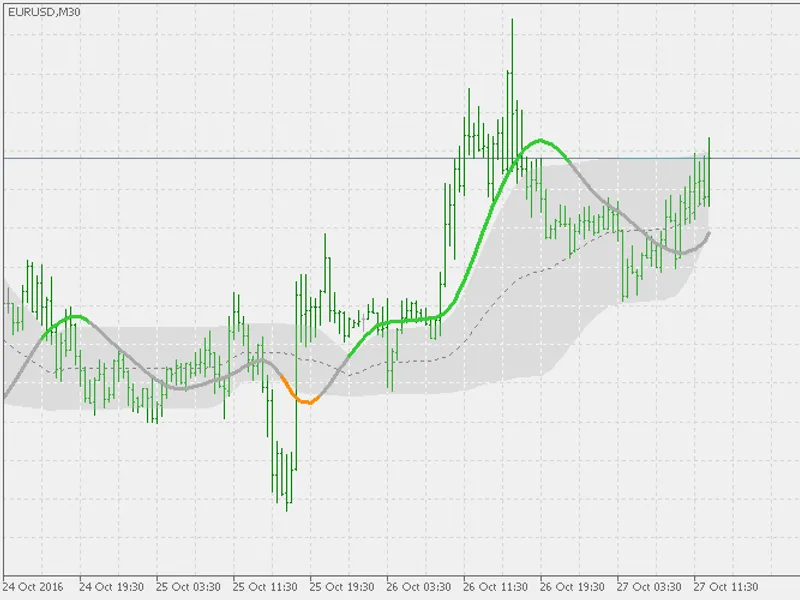
T3 indicator utilizing floating levels to determine trend direction.This indicator employs an extended set of 22 price types and adapts its colors and alerts based on three conditi...
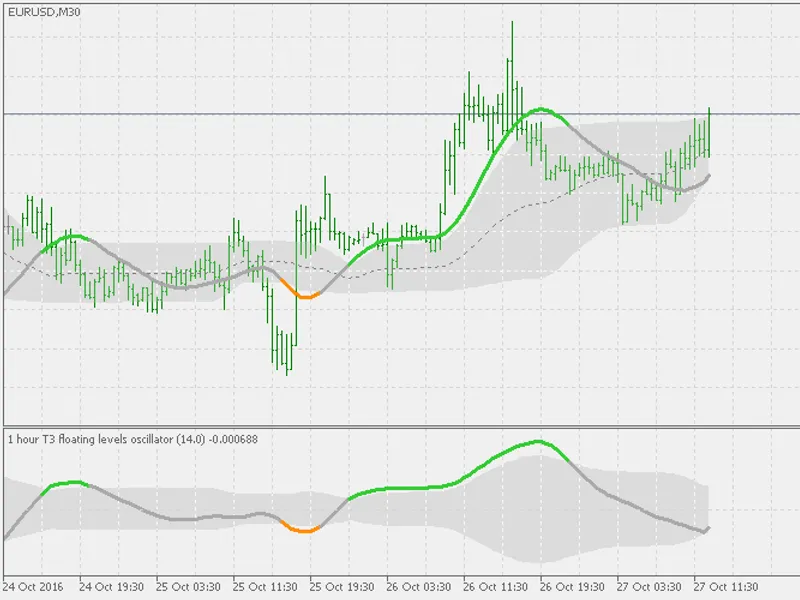
T3 indicator with floating levels, transformed into an oscillator.This indicator is an extension of the T3 Floating Levels indicator, designed to provide additional insights into t...
This library offers a wide range of functions designed to streamline the development process in MQL4, allowing you to focus on logic rather than mechanics.For instance, opening an ...
The SAW_System_1 Expert Advisor is designed to strategically place pending orders based on historical volatility. It calculates the stop loss and take profit as a percentage of ave...
This Expert Advisor (EA) employs a grid trading strategy, opening positions based on price movement. It creates a grid by buying when the price moves down one step and selling when...
This indicator is designed for testing and practicing manual trading strategies. It offers comprehensive operation reports in table and chart formats, saving templates with and wit...
This script facilitates the initiation of binary option trades through the MetaTrader 4 platform, provided your broker offers this functionality.The input parameters encompass the ...
The OANDAX product series is designed to display additional data on orders and positions provided by the OANDA FXLabs service.The OANDAX OrderBook Chart indicator is designed to di...
When executed on the price chart, this script adjusts the stop loss or take profit of all open orders for the selected instrument.For instance, if you have multiple buy positions o...
This indicator displays two text labels at the bottom right corner of the chart, showing the current spread and time remaining until the next candle closes.Users can customize the ...
Added trailing stop and breakeven features, which are activated based on specific conditions:- Trailing stop is enabled if 'trailing_use' is set to true and the last order has clos...
This indicator identifies the price pivot point, a crucial level where price reversal is likely.When candles form a pattern with wicks that can be intersected by a line, it often s...
An Expert Advisor (EA) designed for MetaTrader 4/5, utilizing the Relative Strength Index (RSI) indicator for trading signals.This EA employs a straightforward strategy: it sells w...
Semi-automatic grid assistant Expert Advisor designed for placing and managing grids.This Expert Advisor provides a set of buttons for easy grid management:- "Buy Stop" - Open a gr...
This expert advisor is designed to manage order trailing, a crucial feature for traders seeking to maximize profits. It offers a unique approach by initiating trailing once a speci...
This Expert Advisor (EA) is designed to enhance your trading strategy by automatically adjusting the stop loss to break-even once a specified profit level is achieved.Key Features:...
This indicator calculates and displays the price change as a percentage relative to the open price of the current candle.Key features:- Percentage price change calculation based on...
The check mark pattern is a technical analysis tool used to predict the type of the next candle: bullish or bearish.This pattern is plotted similarly to the 'Three Inside Up/Down' ...
This indicator calculates and displays the difference between the arithmetic mean and geometric mean of the price.The price is determined using the formula: (O+H+L+C)/4, where O re...
This indicator calculates and displays the difference between the estimated values of the current and previous bars.The estimated value is derived from the difference between the a...
Class for working with ticks in MetaTrader 4, enabling the creation of experts that make trading decisions based on tick data analysis.The class facilitates the calculation of:- Pr...
This indicator provides a comprehensive view of trading performance by displaying the total volume and profit of trades for each direction.Key features:- Volume and profit monitori...
This cross-platform library enables efficient and rapid comparison of 'double' values for the 'price' variable.For instance, prior to executing a selllimit order, it can be advanta...
This indicator calculates and plots two channels based on the price movement over a specified number of bars (default 200). The channels represent the limits where the price ranges...
This indicator provides a simple yet powerful tool for traders, displaying the moving average for the chosen timeframe.It offers a clear and concise way to visualize the trend and ...
The default chart grid has certain limitations that hinder the immediate identification of price movements. The grid step adjusts dynamically when changing timeframes, and it doesn...
This cross-platform library enables byte-wise operations with structures and standard data types, offering a range of features:- Byte-wise comparison (== and !=) of structures and ...