Metro Stochastic Sign IndicatorA semaphore signal indicator utilizing an indicator color change algorithm.Figure 1. The Metro Stochastic Sign Indicator....
HL Average IndicatorThis indicator displays pivot, support, and resistance levels.The indicator was originally written in MQL4 and first published on 24.09.2026.Figure 1. The HL Av...
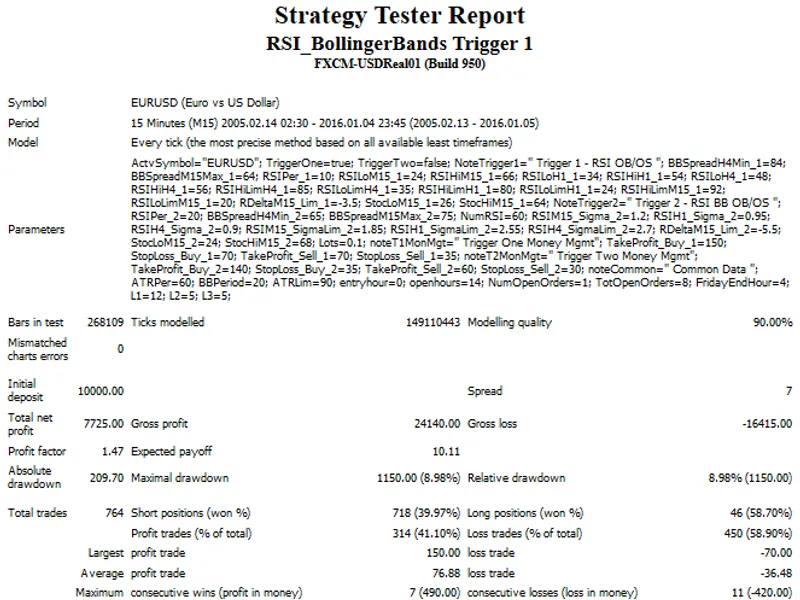
This program uses overbought (OB) and oversold (OS) regions in RSI space to generate short and long trading signals.
OB and OS zones are established for the M15, H1, and H4 time fr...
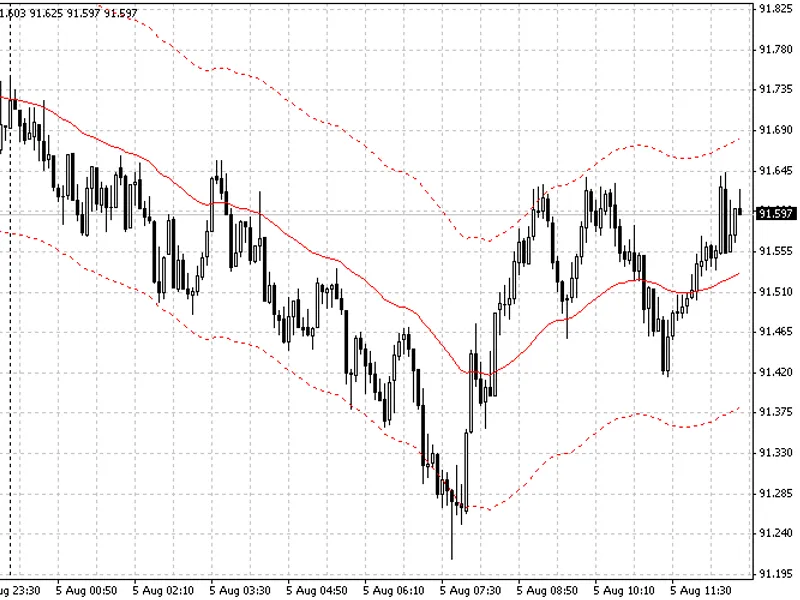
This Expert Advisor (EA) utilizes moving average channel boundary data for trading decisions. When the price deviates from the moving average by a specified number of points, an or...
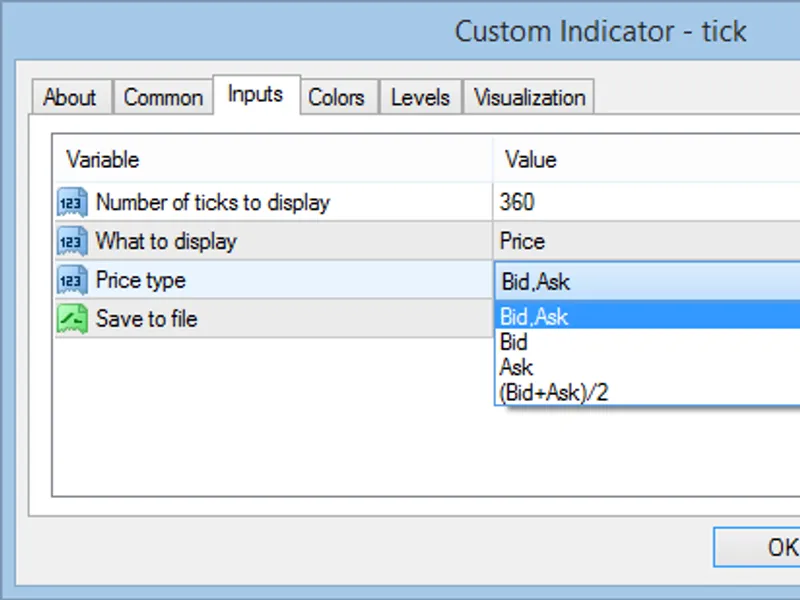
The indicator displays the tick chart of the price, spread, or volume.It is possible to save the tick data in a file which can later be opened in Excel or another program.Input par...
An arrangement of pending orders placed at equal intervals.In the event the market moves against a purchased lot, an opposite order is placed with an increased volume.The Expert Ad...
This indicator displays nine values for two different moving averages (MA), including the difference between sequential MA values and the difference between MAs in points.It offers...
A 24-hour analog GMT (UTC) market clock designed to be displayed in the background.The clock shows the Greenwich Mean Time and indicates the operational status of major global stoc...
This Expert Advisor calculates the profit or loss in the deposit currency for all market orders opened on the current chart, at a specified price. The calculation is based on a hor...
A unique interpretation of moving average indicators.The Ultra Oscillator is a technical analysis tool designed to provide insights into market momentum.Key Features:- Utilizes a p...
The Rate of Change (ROC) indicator displays the percentage change in price over a specified period for selected currency pairs. It plots this change as bars in a separate indicator...
This indicator displays the server time and the time remaining until the current candlestick closes on M1-D1 timeframes.SettingsThe indicator accepts a single parameter: a space-se...
This Expert Advisor executes trades based on a defined trading strategy, incorporating take profit and stop loss levels. It enhances trade security by moving the stop loss to break...
The Random Direction EA operates on the principle of a coin flip.Trading AlgorithmThe EA opens a market order using a random number generator, essentially trading in a random direc...
The indicator plots two Stowell patterns on the right edge of the chart: upper and lower.A breakout of the three-candle line signifies a trend change according to Stowell's methodo...
This indicator displays the trend direction for multiple currency pairs on the current timeframe.The indicator operates by comparing three Moving Average (MA) indicators with diffe...
The MA VA-XONA X Expert Advisor utilizes moving averages calculated from open and close prices to generate trading signals.To implement this strategy, attach four Moving Average in...
DayATR is an Average True Range (ATR) indicator.The indicator period is automatically calculated using the number of bars of the current day.Supported timeframes: M1-D1.Note: The i...
DayBB is a Bollinger Bands indicator where the indicator period is calculated automatically based on the number of bars for the current trading day.
Timeframe: M1-D1.
On initial ...
The Day Bears indicator measures bearish power. The indicator period is calculated automatically based on the number of bars of the current trading day.Supported timeframes: M1 thr...
The Day Bulls indicator measures bullish momentum.The indicator's period is automatically calculated based on the number of bars within the current trading day.It is suitable for t...
Day CCI is the Commodity Channel Index indicator where the indicator period is calculated automatically using the number of bars of the current day.
Timeframe: M1-D1. On the first...
The Day DeMarker Indicator is a variation of the DeMarker indicator that dynamically calculates its period based on the number of bars within the current trading day.Supported Time...
Day Force is an indicator that automatically calculates the indicator period based on the number of bars in the current day.
Timeframe: M1-D1. The indicator requires an initial ca...
Day MA is a moving average indicator where the period is automatically calculated based on the number of bars in the current day.Timeframe: M1-D1.On the first run, the indicator re...
Day Momentum is a momentum indicator where the indicator period is calculated automatically based on the number of bars of the current day.
Timeframe: M1-D1. On the first run, the...
Day RSI is a Relative Strength Index indicator where the indicator period is calculated automatically based on the number of bars in the current day.Timeframe: M1-D1.On the first r...
The Relative Vigor Index (RVI) indicator measures the momentum of a security by comparing its closing price to its opening price.The indicator period is calculated automatically ba...
The Day Stochastic indicator calculates the stochastic indicator with a period automatically determined by the number of bars in the current day.Suitable for timeframes from M1 to ...
The Day Williams Percent Range (WPR) indicator calculates the indicator period automatically based on the number of bars in the current day.Supported timeframes: M1-D1.Please note ...
This strategy analyzes newly formed candlesticks. Orders are placed immediately upon a breakout of the previous candlestick's high or low.Once the profit reaches the stop loss valu...
Expert Advisor based on the Labouchere lot management system.Labouchere System OverviewThe Labouchere system is a betting strategy where a trader creates a sequence of desired prof...
This indicator implements the Daily Strategy by Daryl Guppy, originally designed for the securities market and later adapted for the currency market.Recommendations:- Currency pair...
This indicator displays price changes in points and the frequency of these changes over a selected period, specifically from the indicator's launch to its stop.There are no input p...
A straightforward, classic moving average indicator that changes color based on the trend direction.This indicator offers clearer insights into the current average price.VR Moving ...
The Forex Fraus Slogger Expert Advisor builds upon the functionality of its predecessor, integrating the Envelopes indicator for its trading strategy.This Expert Advisor is specifi...
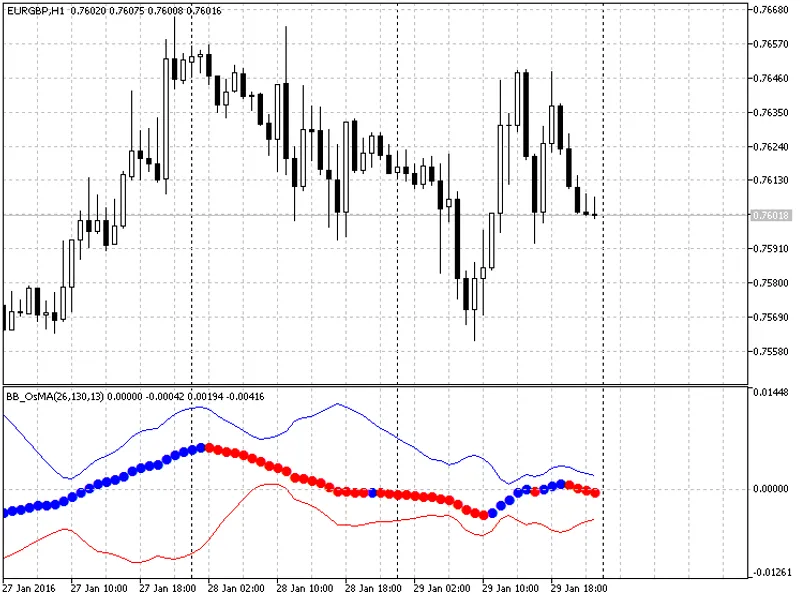
BB OSMA Indicator is a Forex indicator for MetaTrader 5.
This indicator presents the OSMA indicator in a spheroid form, incorporating deviation as upper and lower bands.
Key Featur...
The Price Percentage Range indicator for MetaTrader 5 calculates price movement based on the percentage difference between the highest and lowest prices over 100 bars.
This indicat...
This indicator represents the Third Generation Moving Average. It aims to provide a faster reaction to price changes compared to conventional Exponential Moving Averages.Input Para...
Coppock IndicatorThe Coppock Indicator is an implementation of the famous Coppock Curve indicator, originally developed by Edward Coppock in 1962.Input Parameters:- ROC1Period (Def...
The Aroon Up and Down indicator measures the strength of a trend by calculating the time elapsed since the last high and low prices occurred within a specified period.Input Paramet...
The Pin Bar Detector identifies pin bars and marks them with 'smileys' below bullish and above bearish patterns. This indicator relies solely on price action for its calculations, ...
The Binario Expert Advisor utilizes exponential moving averages of the same period but with different price types (high and low). This EA does not rely on explicit buy or sell sign...
This indicator is designed to trade using divergence.
It allows for the selection of one of 30 oscillators to detect divergences.
Key features include:
- Displaying extremes as poi...
Wide Range Bar (WRB) and Hidden Gap IndicatorThis indicator detects and marks Wide Range Bars (WRBs) or candlesticks with wide range bodies. Since WRBs are not useful on their own,...
The Dots indicator is based on an indicator developed by trendlaboratory in 2006. The indicator displays the current trend direction by placing colored dots on the main chart. Blue...
Easy Trend Visualizer is a straightforward indicator designed to clearly show trend start and end points, as well as periods of no trend.It utilizes the standard Average Directiona...
Candlestick Gain/Loss Analysis ToolThis indicator displays the current gain and loss for all candlesticks that exceed a specified threshold. Values are calculated in both percentag...