









Realized Volatility: Range Volatility Estimators, Realized Variance, and HAR Forecasts
Info
The Realized Volatility: Range Volatility Estimators, Realized Variance, and HAR Forecasts is a Script for MetaTrader 5 that realizedvol. mqh measures and forecasts volatility from prices.
Usage
This tool is typically used for enhancing chart analysis and decision making.
Platform
This Script works exclusively on MetaTrader 5 (both build 600+ and newer versions).
Setup
Place the downloaded file in MQL5/Scripts folder via File ? Open Data Folder in MetaTrader 5.
How to Install and Use Realized Volatility: Range Volatility Estimators, Realized Variance, and HAR Forecasts
1. Installation: Move your script file into the MQL/Scripts directory and restart the platform.
2. Execution: Drag the script onto a chart; it will perform a one-time action, such as closing all open orders or clearing chart objects.
3. Editing: Use MetaEditor (F4) to modify code, click "Compile," and verify no errors appear in the terminal before running.
4. Removing: Scripts stop automatically, but you can remove them manually by right-clicking the chart and choosing "Remove Script."
Frequently Asked Questions
Q: How are scripts different from EAs? A: Scripts execute a single action and then stop; EAs monitor the market and trade continuously.
Q: Can I assign a hotkey to a script? A: Yes, right-click the script in the Navigator, select "Set Hotkey," and define your preferred keyboard shortcut.
Q: Why did my script stop? A: Scripts are designed to stop immediately after finishing their programmed command; this is normal behavior.
What this tool does
RealizedVol.
Typical Use Case
This Script excels in automated trading and technical analysis on MetaTrader 5.
Compatible Platform & Setup
This Script works on MetaTrader 5. Place the file in the MQL5/Scripts folder and restart the terminal.
Description & Settings
Related: calculate unrealized profit(s) at a specific time in history - another powerful script for MetaTrader 5 traders.
RealizedVol.mqh measures and forecasts volatility from prices.Also recommended: quick script to browse signals, searching for your own parameters - similar script with strong performance on MetaTrader 5.
It includes five estimators for OHLC bars: Parkinson, Garman-Klass, Rogers-Satchell, and Yang-Zhang, along with a close-to-close estimator.It also provides daily realized variance, bipower variation, and realized quarticity calculated from intraday bars. The bipower variation isolates the component of variance free from jumps.
Furthermore, it implements the HAR model by Corsi (2009), a standard benchmark for forecasting realized volatility, complete with Newey-West standard errors. No DLLs are required.
Usage
#include <RealizedVol\RealizedVol.mqh>
MqlRates d1[], m5[];
CopyRates(_Symbol, PERIOD_D1, 1, 21, d1);
CopyRates(_Symbol, PERIOD_M5, 1, 300 * 288, m5);
double yz = CRangeVolatility::Estimate(d1, 20, 20, RV_YANG_ZHANG); // variance per day over the last 20 days
double vol = 100.0 * MathSqrt(yz * 252); // % a year
datetime days[];
vector rv, bv, rq;
int counts[];
CRealized::Daily(m5, days, rv, bv, rq, counts); // realized and bipower variance per day
CHar har;
if(har.Fit(rv, 5, true)) // HAR on log realized variance, 5 days ahead
{
double week = 100.0 * MathSqrt(har.Forecast() * 252); // volatility expected over the next 5 days
}
Components
CRangeVolatility
: The Estimate() function can be used over any window of bars, while Rolling() calculates values for every bar.
The range estimators utilize the high and low of each bar, requiring 5 to 8 times fewer bars than close-to-close methods to achieve the same precision.
The Rogers-Satchell estimator accounts for drift, and the Yang-Zhang estimator also includes gaps between bars (e.g., weekend or overnight gaps).
CRealized::Daily
: This function generates one value per day using intraday bars, considering only the returns within each day (excluding the gap from the previous day). It allows for a shift to define the start of the day and requires a minimum number of bars.
The Jump() function extracts the portion of the variance attributable to jumps.
CHar
: This component implements the HAR model. It regresses the average realized variance of the next 1, 5, or 22 days on the previous day's variance and the averages of the past 5 and 22 days.
The regression can be performed on levels or logs and includes Newey-West standard errors, R-squared values, and forecasts.
Example
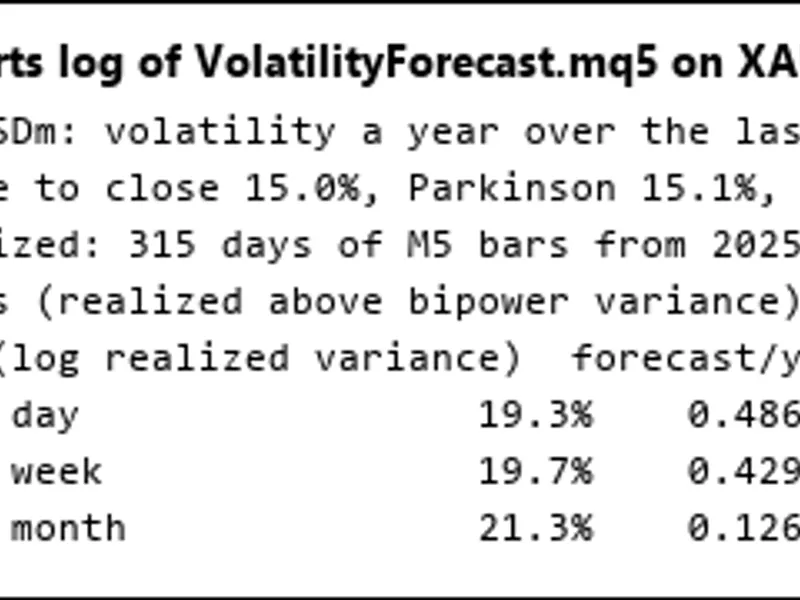
The script VolatilityForecast.mq5 demonstrates the calculation of a symbol's volatility over the last 20 days using the five estimators.
It also shows the realized volatility derived from M5 bars (for the last day and the last 22 days), the contribution of jumps to this volatility, and HAR forecasts for the next day, week, and month, along with their t-statistics (refer to picture 1).
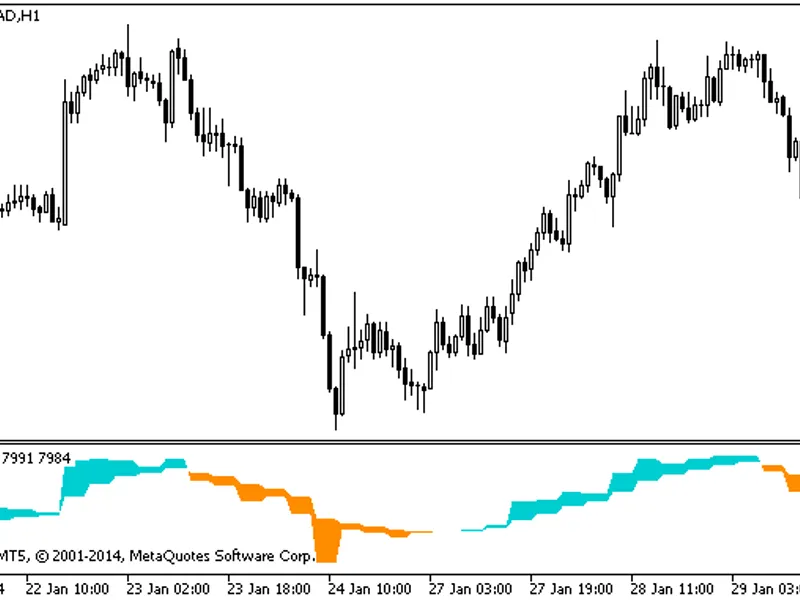
Additionally, the script can export daily realized and bipower variances to a CSV file (refer to picture 2).
Verification
The five estimators with window sizes of 10, 20, and 60 bars were tested on BTCUSDT D1 and XAUUSD H1 against an independent pandas implementation.
You may also like: cross - excellent alternative for script users on MetaTrader 5.
Source Code
#property copyright "RobotFX"
#property version     "1.00"
#property script_show_inputs
#include <RealizedVol\RealizedVol.mqh>
input string InpSymbol  = "";
input int    InpWindow  = 20;
input int    InpDays    = 300;
input double InpPerYear = 252;
input int    InpShift   = 0;
input string InpCsv     = "";
.......
⚠ Limitations & Risk Warning
- This tool is provided for educational and testing purposes only.
- Past performance does not guarantee future results.
- Trading involves substantial risk of loss. Use on a demo account first.
- Results may vary depending on market conditions, broker, and settings.
- We recommend thorough backtesting and forward testing before using with real funds.