Spreads
This software component for MetaTrader 5 is built to enhance the capabilities of your trading environment. This technical indicator acts as a specialized analysis tool designed to visualize market data. It helps traders identify emerging trends, momentum shifts, and key support or resistance levels by plotting statistical calculations directly onto price charts.
How to Setup and Use Spreads
1. Installation: Place your file in the MQL/Indicators folder via "Open Data Folder" and restart your terminal.
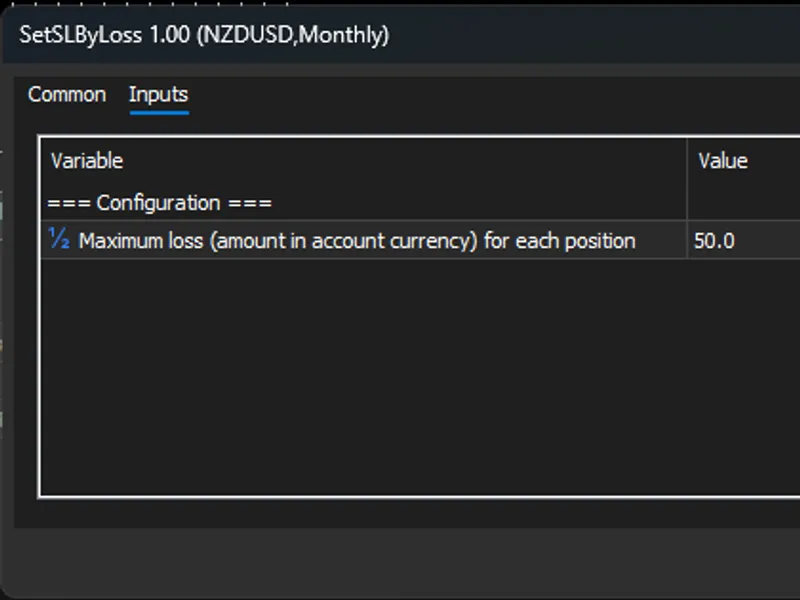
2. Loading: Find the indicator in the Navigator, drag it onto your chart, and configure the input parameters in the popup window.
3. Customization: Press Ctrl+I to open the indicator list, select your tool, and click "Properties" to change colors, levels, or visual styles.
4. Updating: Replace the old file in the Indicators folder with the new version and restart the platform to apply changes.
Frequently Asked Questions
Q: Why is my indicator not showing? A: Verify the file is in the MQL/Indicators folder, or try right-clicking the "Indicators" tree in the Navigator and clicking "Refresh."
Q: Do custom indicators slow down the platform? A: Too many complex indicators can impact performance; remove unused ones via the "Indicator List" (Ctrl+I).
Q: Can I use MT4 indicators on MT5? A: No, MQL4 and MQL5 are distinct languages; ensure the indicator is compiled specifically for your platform version.
Description & Settings
Spread is realised through the difference of quotes of two symbols. If symbols quotes move in reverse - the second symbol is put in reverse. In this case the spread is calculated through the sum of quotes.
Only quotes of the second symbol of the spread are put in reverse. The names of variables are clear in meaning. It is obligatory to use the indicator when both symbols of the spread are traded - quoted according to the time of the beginning - end of trading sessions.
Use of the indicator is possible when spread trading: for flat trading - increased - sell, decreased - buy. Variability in interpretation of indicator values is also possible. It is possible to trade
lines - support and resistance levels and sloping lines from the spread chart after crossing them.
The code is commented out in detail, to set the indicator on the first symbol of the spread, variables are used to bring to integers for easy viewing and analysis of levels and values of the indicator,
in which we specify the number of decimal places as a multiplier, for example, if 5 decimal places are quoted, we set the value to 100000.
In fact, you can use many interpretations of the indicator values and breakdowns and bounces from levels for example - the variability is available, you can look and choose the most ideologically suitable variant for you.
suitable variant.
For example, you can use the trend interpretation of the spread quotes movement, for example, by seasonality.
An example of using the classical interpretation of AUDUSD-USDCAD spread, trading in the range. It is also possible to overlay standard figures of technical analysis and technical indicators, for example, envelopes, on the spread chart for a clearer interpretation of its values.