Uniformity Factor Indicator
This software component for MetaTrader 5 is built to enhance the capabilities of your trading environment. This technical indicator acts as a specialized analysis tool designed to visualize market data. It helps traders identify emerging trends, momentum shifts, and key support or resistance levels by plotting statistical calculations directly onto price charts.
How to Setup and Use Uniformity Factor Indicator
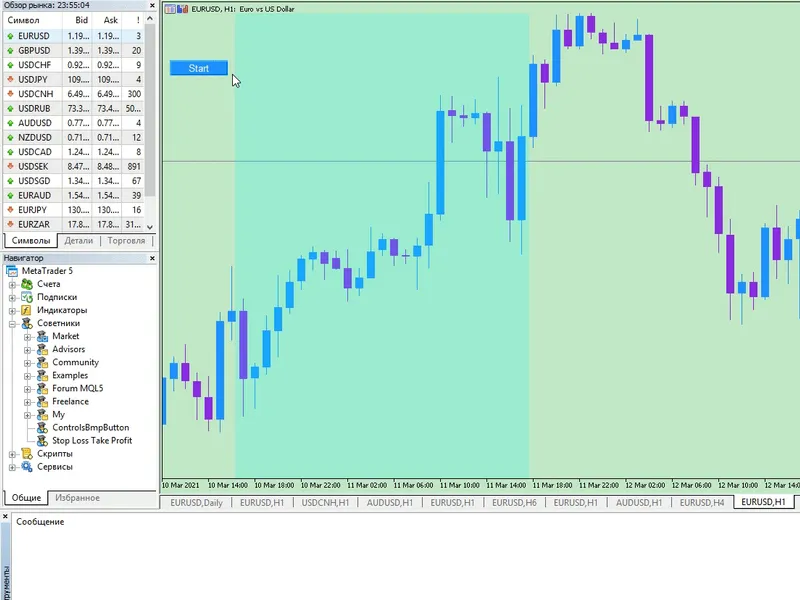
1. Installation: Place your file in the MQL/Indicators folder via "Open Data Folder" and restart your terminal.
2. Loading: Find the indicator in the Navigator, drag it onto your chart, and configure the input parameters in the popup window.
3. Customization: Press Ctrl+I to open the indicator list, select your tool, and click "Properties" to change colors, levels, or visual styles.
4. Updating: Replace the old file in the Indicators folder with the new version and restart the platform to apply changes.
Frequently Asked Questions
Q: Why is my indicator not showing? A: Verify the file is in the MQL/Indicators folder, or try right-clicking the "Indicators" tree in the Navigator and clicking "Refresh."
Q: Do custom indicators slow down the platform? A: Too many complex indicators can impact performance; remove unused ones via the "Indicator List" (Ctrl+I).
Q: Can I use MT4 indicators on MT5? A: No, MQL4 and MQL5 are distinct languages; ensure the indicator is compiled specifically for your platform version.
Description & Settings
This is a simple analytical (non-signal, one-time calculated) indicator that allows you to test the hypothesis that price timeseries represent a "random walk", specifically Gaussian "random walk". This can help to construct a parametric transformation of price increments into evenly distributed, more stable and predictable time series, at least in terms of volatility.
As you may know, the distance that a "random walk" variable is expected to cover after N steps is estimated by its standard deviation multiplied by sqrt(N), or N^0.5.
This indicator calculates statistics of "average" price change (per bar) for predefined subranges of bars. The "averaging" is performed over the distance (number of bars up to given N) taken to the power of F — a factor, which is enumerated from 0.1 to 1 with the step 0.1.
All bars available on current chart are used for collecting statistics in sliding windows of up to N bars.
Then the indicator finds most "regular" uniform distribution of the statistics among different F's, and displays a histogram for this factor (considered optimal), usually 0.5 or 0.6. Each column of the histogram is the "average" delta of points per bar for corresponding trade duration (number of bars), where "averaging" is made by N^F (when F=1 you'll get standard averaging).
The indicator can use different methods for automatic detection of the "regularity" (flatness) of the statistical curve:
minimum of variance;
minimum of difference between triple M's (Mean, Median, Mode), as squared error;
minimum of Gini coefficient;
Knowing the optimal factor can be useful for:
normalization of input data (price changes) for neural networks and other machine learning algorithms;
estimation of sufficient number of bars for sampling into a single input vector for analisys in volatility trading systems;
detection of symbols and/or timeframes with anomalities (non-standard F or singularity in the distribution curve); Inputs
Period — maximal distance in bars (N) to use for collecting price range statistics, by default 200;
Factor — exponent for "averaging" over distances, by default 0 - means autodetection, you can enter a custom value between 0.0 and 1.0 for estimation, for example, 0.525;
Method — one of the methods of estimation of uniformity: variance, triple_M, Gini;
MaxBars — a limit of bars to calculate statistics on, by default 0 - means all available bars; NB: if you use unlimited number or hundreds of thousands of bars on chart, the calculation may take some time — if this is a problem, consider limiting the number of bars to tens of thousands. Outputs
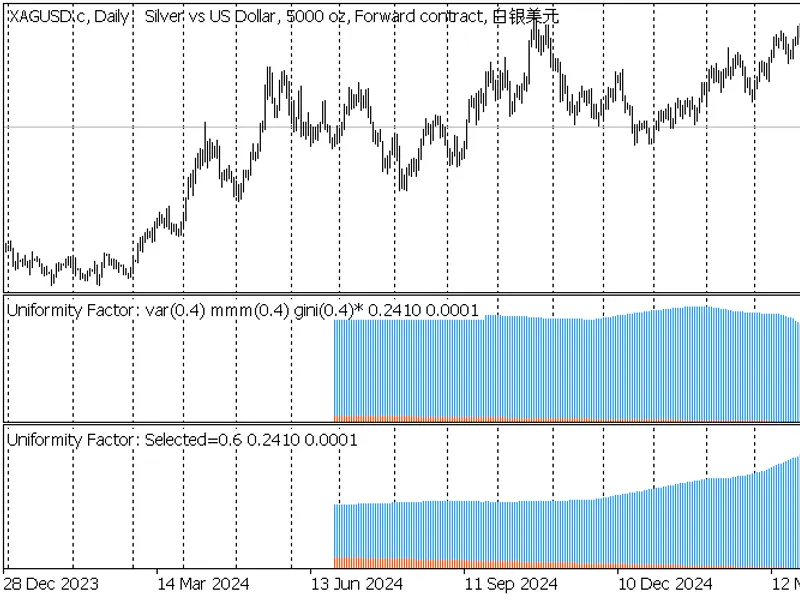
The indicator shows a blue histogram of average price change per bar for each distance in the range of distances (1..Period) and for selected factor of uniformity.
Also a continuously increasing number of bars (distance) is presented as the second histogram (orange), just for reference.
A complete table of tested factors and corresponding metrics of current timeseries are printed in the log.
Screenshots
The following screenshots demonstrate the indicator on 3 timeframes: D1, H1, M1.
Each chart contains 2 instances of the indicator:
upper one is configured for F autodetection by Gini, and the found value (varied between 0.4 once, and 0.5 twice) is displayed in the title, marked by asterisk;
lower one is configured for predefined F=0.6;
2 indicators Uniformity Factor on XAGUSD,D1
2 indicators Uniformity Factor on XAGUSD,H1
2 indicators Uniformity Factor on XAGUSD,M1