









After-Exit Analyzer: Uncovering Missed Opportunities and Potential Pitfalls Post-Trade
Info
The After-Exit Analyzer: Uncovering Missed Opportunities and Potential Pitfalls Post-Trade is a Script for MetaTrader 5 that this script analyzes trading performance by examining price action *after* a trade has been closed. It goes beyond the typical trade report, which ends at the exit point, to reveal what happened next in the market.
Usage
This tool is typically used for enhancing chart analysis and decision making.
Platform
This Script works exclusively on MetaTrader 5 (both build 600+ and newer versions).
Setup
Place the downloaded file in MQL5/Scripts folder via File ? Open Data Folder in MetaTrader 5.
How to Install and Use After-Exit Analyzer: Uncovering Missed Opportunities and Potential Pitfalls Post-Trade
1. Installation: Move your script file into the MQL/Scripts directory and restart the platform.
2. Execution: Drag the script onto a chart; it will perform a one-time action, such as closing all open orders or clearing chart objects.
3. Editing: Use MetaEditor (F4) to modify code, click "Compile," and verify no errors appear in the terminal before running.
4. Removing: Scripts stop automatically, but you can remove them manually by right-clicking the chart and choosing "Remove Script."
Frequently Asked Questions
Q: How are scripts different from EAs? A: Scripts execute a single action and then stop; EAs monitor the market and trade continuously.
Q: Can I assign a hotkey to a script? A: Yes, right-click the script in the Navigator, select "Set Hotkey," and define your preferred keyboard shortcut.
Q: Why did my script stop? A: Scripts are designed to stop immediately after finishing their programmed command; this is normal behavior.
What this tool does
This script analyzes trading performance by examining price action *after* a trade has been closed.
Typical Use Case
This Script excels in automated trading and technical analysis on MetaTrader 5.
Compatible Platform & Setup
This Script works on MetaTrader 5. Place the file in the MQL5/Scripts folder and restart the terminal.
Description & Settings
Related: Scripts for Opening Short Positions - another powerful script for MetaTrader 5 traders.
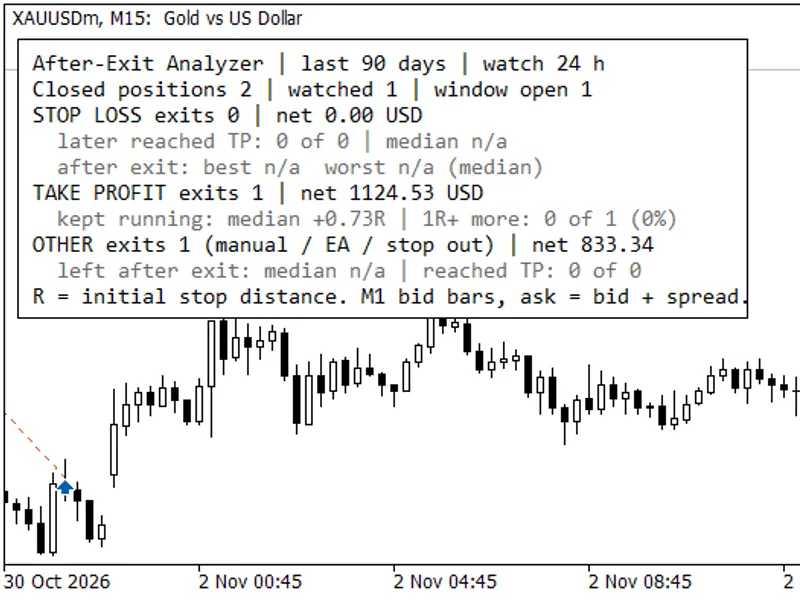
This script analyzes trading performance by examining price action *after* a trade has been closed. It goes beyond the typical trade report, which ends at the exit point, to reveal what happened next in the market.Also recommended: Chart and Timeframe Navigation Hotkeys for MT4/MT5 - similar script with strong performance on MetaTrader 5.
For every closed position within a specified period, the script reads subsequent M1 (1-minute) bars. It then measures, starting from the exit price:
- The best potential profit left unrealized (the maximum favorable price movement).
- The worst potential loss avoided (the maximum unfavorable price movement).
- Whether the take-profit level was reached after the exit and the time it took.
Understanding the Results
Stop-Loss Exits:
- Analysis includes the number of stopped-out trades that later reached their take-profit target.
- It reports the median time taken to reach the target after the stop-out.
- It shows the median price movement in the trade's favor after the stop-out.
- Findings suggesting a stop-loss was too tight or placed at a commonly targeted level are highlighted.
Take-Profit Exits:
- Assesses how far the price continued to move in the trade's favor after the take-profit was hit.
- Indicates the frequency with which price moved an additional 1R (Risk/Reward multiple) or more beyond the target.
- A significant occurrence suggests that the take-profit level or exit strategy might be cutting winning trades short.
Other Exits (Manual, EA Logic, Mobile, Stop Out):
- Reports the median profit left on the table after these types of exits.
- Shows the frequency with which the original take-profit target was still achieved after the exit.
Measurement Units:
- Price movements are displayed in R multiples (based on the initial stop-loss distance) when a stop-loss was defined. Otherwise, movements are shown in points.
Output Details
Summary Panel: A visual summary is displayed directly on the chart.
Experts Log: A detailed table for each position is available in the Experts tab, with the most recent exits listed first.
CSV File: For in-depth personal analysis, a CSV file (named AfterExit_<login>.csv) is generated in the MQL5\Files directory, containing one row per position.
Script Inputs
Input Parameter
Default Value
Description
History to analyze (days)
90
The number of past days to include in the analysis.
Symbol filter
""
Leave empty to analyze all symbols; specify a symbol to filter results.
Magic number filter
-1
-1 analyzes all trades; 0 analyzes manual trades only; specific numbers filter by EA magic number.
Market hours to watch after each exit
24
Duration in M1 bars to monitor post-exit. Weekends do not consume this window.
Positions listed in the Experts log
25
The number of rows displayed in the Experts tab.
Write a CSV file
true
Enables or disables the creation of the AfterExit_<login>.csv file.
Draw the summary panel
true
Enables or disables the display of the summary panel on the chart.
Methodology and Considerations
Position Aggregation: Positions are reconstructed from individual deals based on their unique position ID. Commission, swap, and fees are incorporated into the net profit calculation.
Exclusions: Positions with multiple entry deals, reversal trades, or partial closures are omitted from the analysis due to the lack of a single, clear entry and stop-loss point.
Stop-Loss and Take-Profit Basis: The initial stop-loss is determined by the SL recorded on the entry deal, or on the exit deal if no entry SL was present. The take-profit level tested is the TP value at the time of the trade's exit.
Price Data: M1 bars primarily use bid prices. For sell positions, the ask price is estimated by adding the bar's recorded spread to the bid price.
Data Completeness: A position is only included in the statistics if the complete M1 bar window following its exit is available. Recent exits with incomplete post-exit data are marked as 'window open' and excluded from statistical calculations.
Approximation: Due to the nature of M1 data, which records the open, high, low, and close within a minute but not the exact sequence of intra-minute price movements, results within a single minute are approximate.
Script Functionality: This script operates solely as a historical data analyzer. It does not execute trades, utilize external DLLs, or modify any terminal settings.
Usage Instructions
To run the script, simply drag it from the Navigator window onto any chart. Configure the input parameters as needed and click OK. To remove the summary panel after analysis, rerun the script with the 'Draw the summary panel' input set to false.
You may also like: create custom bitmap image script - excellent alternative for script users on MetaTrader 5.
Source Code
#property copyright "RobotFX"
#property link "https://robotfx.org"
#property version     "1.00"
#property description "This code is educational. Feel free to use, modify and upgrade as you wish. Visit ROBOTFX.ORG for professional trading tools"
#property script_show_inputs
input int    InpDaysBack  = 90;
input string InpSymbol    = "";
input long   InpMagic     = -1;
input int    InpLookHours = 24;
input int    InpLogRows   = 25;
.......
⚠ Limitations & Risk Warning
- This tool is provided for educational and testing purposes only.
- Past performance does not guarantee future results.
- Trading involves substantial risk of loss. Use on a demo account first.
- Results may vary depending on market conditions, broker, and settings.
- We recommend thorough backtesting and forward testing before using with real funds.