Statistical Zigzag
This software component for MetaTrader 5 is built to enhance the capabilities of your trading environment. This technical indicator acts as a specialized analysis tool designed to visualize market data. It helps traders identify emerging trends, momentum shifts, and key support or resistance levels by plotting statistical calculations directly onto price charts.
How to Setup and Use Statistical Zigzag
1. Installation: Place your file in the MQL/Indicators folder via "Open Data Folder" and restart your terminal.
2. Loading: Find the indicator in the Navigator, drag it onto your chart, and configure the input parameters in the popup window.
3. Customization: Press Ctrl+I to open the indicator list, select your tool, and click "Properties" to change colors, levels, or visual styles.
4. Updating: Replace the old file in the Indicators folder with the new version and restart the platform to apply changes.
Frequently Asked Questions
Q: Why is my indicator not showing? A: Verify the file is in the MQL/Indicators folder, or try right-clicking the "Indicators" tree in the Navigator and clicking "Refresh."
Q: Do custom indicators slow down the platform? A: Too many complex indicators can impact performance; remove unused ones via the "Indicator List" (Ctrl+I).
Q: Can I use MT4 indicators on MT5? A: No, MQL4 and MQL5 are distinct languages; ensure the indicator is compiled specifically for your platform version.
Description & Settings
standard deviation × multiplier
.
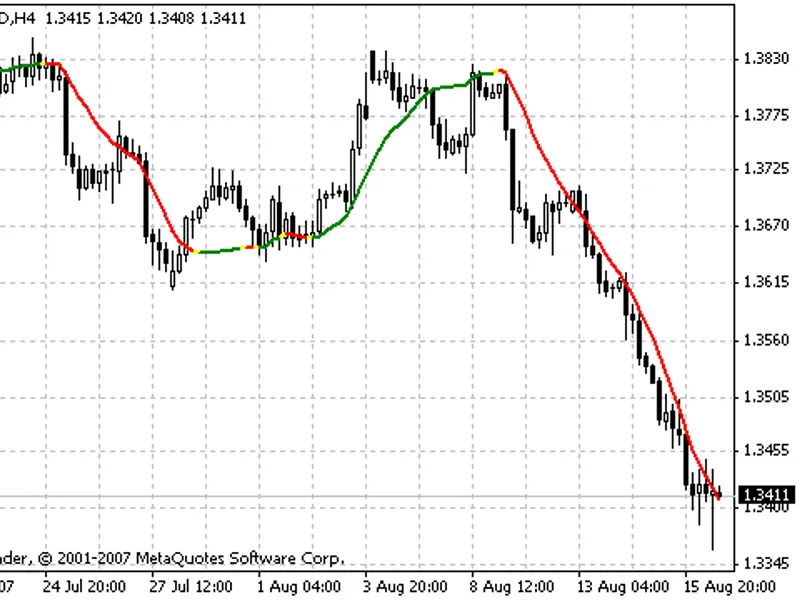
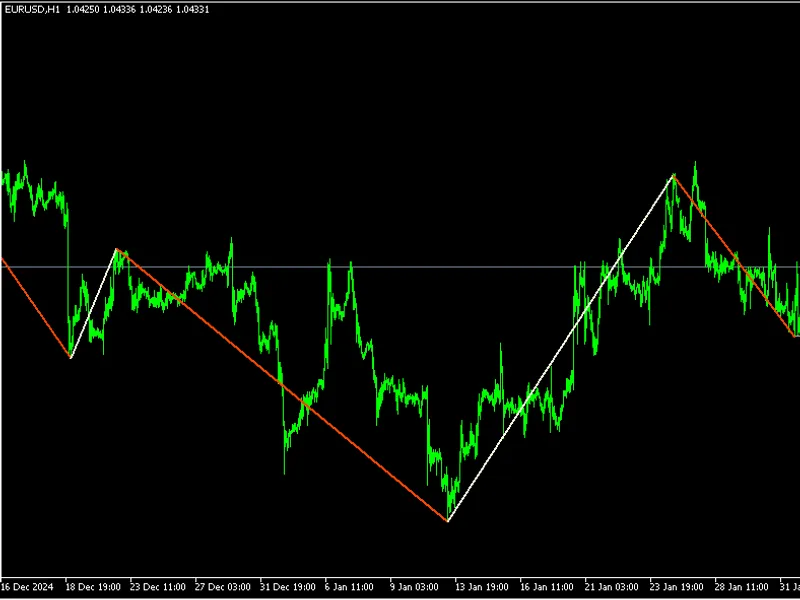
Instead of scanning for absolute highs/lows across a fixed depth, it evaluates extremes relative to the local volatility level and takes the most extreme price within the move that triggered the threshold. Because standard deviation evolves bar-by-bar, the threshold adapts dynamically to changing market conditions.
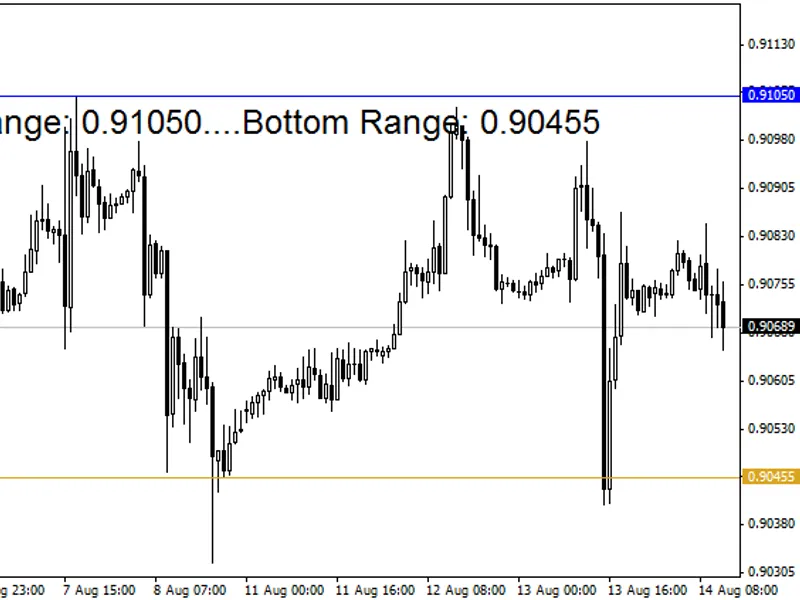
A horizontal line extends from the latest confirmed swing projecting a statistically meaningful boundary: the price is likely to either respect it with a bounce or breach through it with a breakout.
There are many ways to see this indicator. In a bearish trend, you could view price movement above the projected level as noise and place a sell stop just beneath the line, or, enter directly at the level - and exit at breakeven if the price suddenly diverges against the trade.
Understanding the inputs:
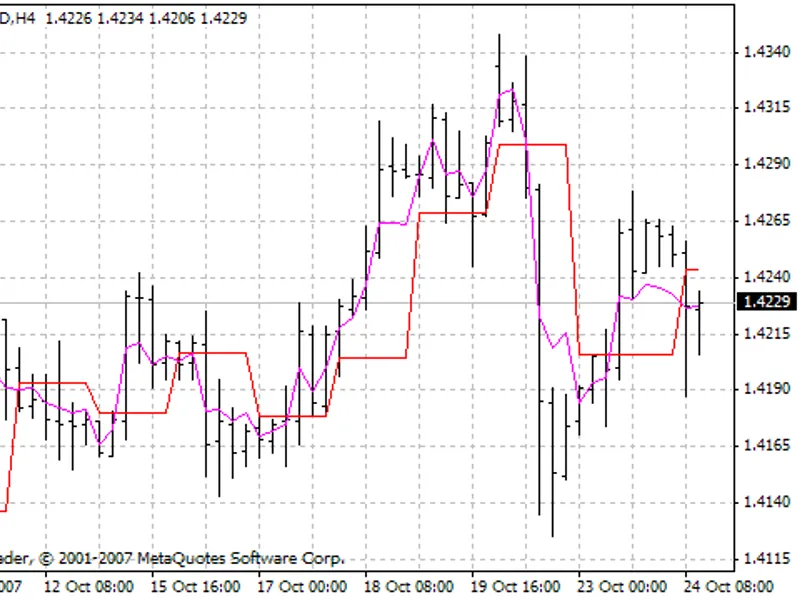
A higher length will mean that the legs will be longer (and there will be less turning points), likewise, a lower length will cause more turning points, and the zigzag legs will be shorter
A higher volatility multiplier means the threshold is harder to trigger -- more rigid legs, a lower volatility multiplier means the threshold is easier to trigger -- more responsive legs