XR A V I
This software component for MetaTrader 5 is built to enhance the capabilities of your trading environment. This technical indicator acts as a specialized analysis tool designed to visualize market data. It helps traders identify emerging trends, momentum shifts, and key support or resistance levels by plotting statistical calculations directly onto price charts.
How to Setup and Use XR A V I
1. Installation: Place your file in the MQL/Indicators folder via "Open Data Folder" and restart your terminal.
2. Loading: Find the indicator in the Navigator, drag it onto your chart, and configure the input parameters in the popup window.
3. Customization: Press Ctrl+I to open the indicator list, select your tool, and click "Properties" to change colors, levels, or visual styles.
4. Updating: Replace the old file in the Indicators folder with the new version and restart the platform to apply changes.
Frequently Asked Questions
Q: Why is my indicator not showing? A: Verify the file is in the MQL/Indicators folder, or try right-clicking the "Indicators" tree in the Navigator and clicking "Refresh."
Q: Do custom indicators slow down the platform? A: Too many complex indicators can impact performance; remove unused ones via the "Indicator List" (Ctrl+I).
Q: Can I use MT4 indicators on MT5? A: No, MQL4 and MQL5 are distinct languages; ensure the indicator is compiled specifically for your platform version.
Description & Settings
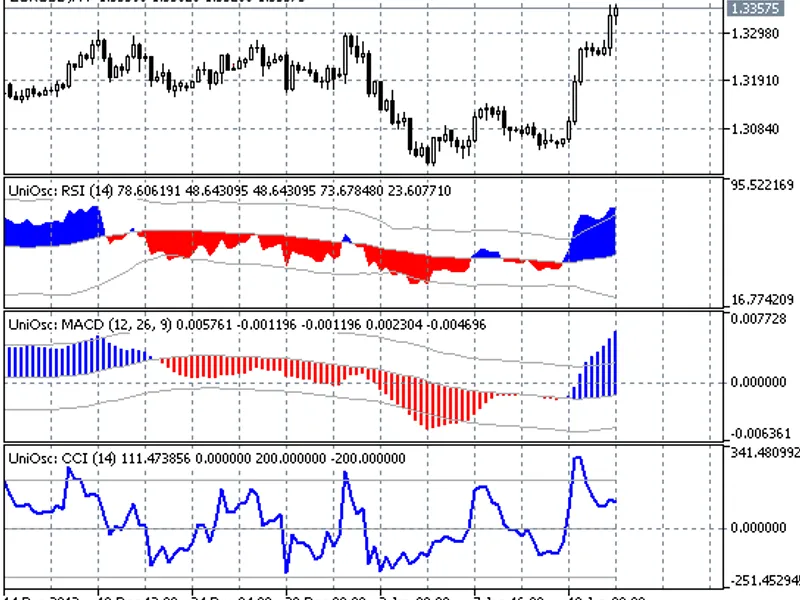
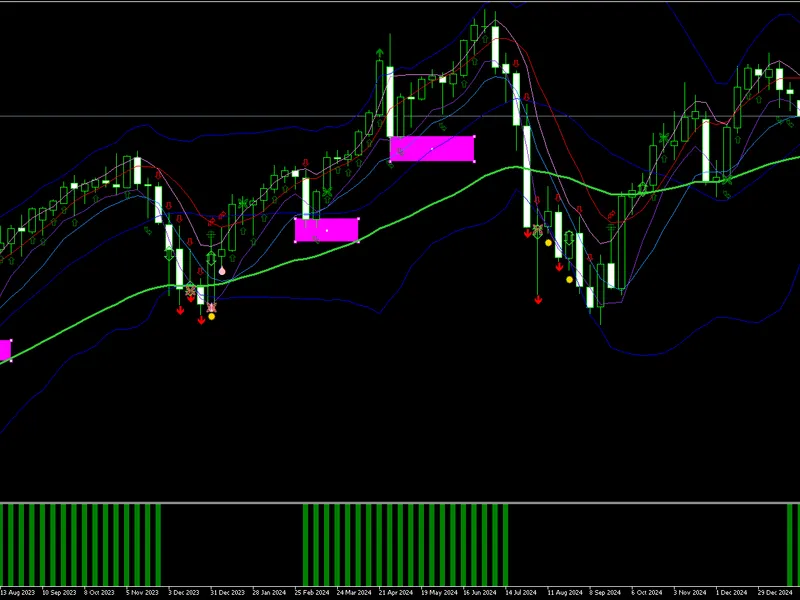
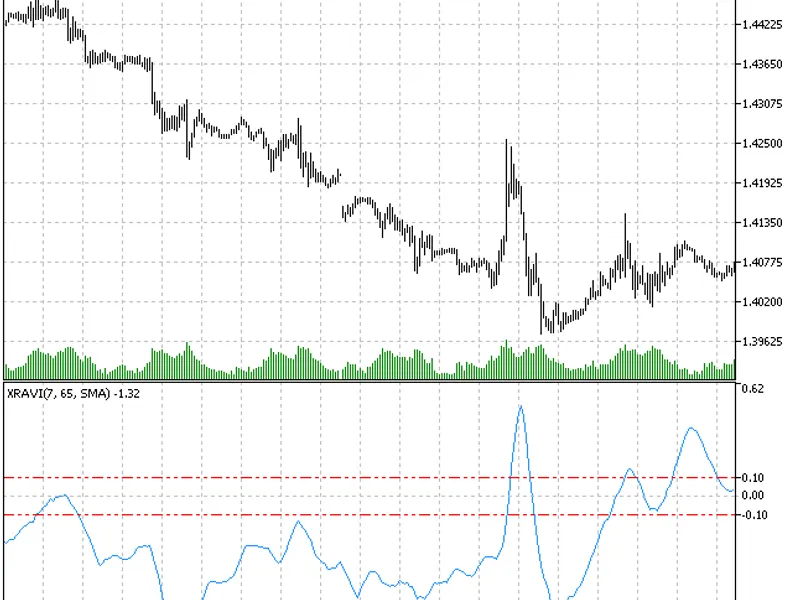
There is a quite useful indicator developed by Т. Chande which is called RAVI (Range Action Verification Index).
The principle of its generation is different from the one used to build the indicator. Chande suggested 13 week SMA as a basis of the RAVI indicator that represents quarter states (quarter – 3 months or 65 working days) of the market participants mood concerning prices. The short average that includes the RAVI indicator comprises 10% from the long one and is equal to seven in rough figures.
RAVI indicator can be expressed the following way:
where SMA(period) - with the period equal to the period.
Chande suggested the following reference lines for the RAVI indicator: plus-minus 0.3% or plus-minus 0.1% is selected depending on the market peculiarities. When the RAVI indicator line crosses the reference line upwards, this is a signal for a new uptrend. When the indicator crosses its reference line downwards, this is a signal for a downtrend. A trend is most likely to continue its growth, while the RAVI indicator line is rising, and it will probably continue its fall, while the RAVI line is going down.
Reversal of the RAVI indicator to the zero line shows that a trend is over and a channel is appearing (forex channel strategy). But repeated reversal of the indicator without entering into a reference lines range shows that a trend is resumed.
Chande's RAVI indicator is quite simple. It is very similar to the and Price Oscillator indicators. The unique feature of RAVI is that it uses the movement convergence-divergence as a trend indicator considering divergence (not crossing) of the averages.
We know that ADX has two smoothings. RAVI has only one. Therefore, RAVI with previously mentioned values is more sensitive and can signal about the beginnig or end of a trend earlier than 18 day ADX.
- simple moving average;
- exponential moving average;
- smoothed moving average;
- linear weighted moving average;
- JMA adaptive average;
- ultralinear smoothing;
- parabolic smoothing;
- Tillson's multiple exponential smoothing;
- smoothing with the use of Tushar Chande's algorithm;
- smoothing with the use of Perry Kaufman's algorithm.
It should be noted that Phase type parameters for different smoothing algorithms have completely different meaning. For JMA it is an external Phase variable changing from -100 to +100. For T3 it is a smoothing ratio multiplied by 100 for better visualization, for VIDYA it is a CMO oscillator period and for AMA it is a slow EMA period. In other algorithms these parameters do not affect smoothing. For AMA fast EMA period is a fixed value and is equal to 2 by default. The ratio of raising to the power is also equal to 2 for AMA.
The indicator uses SmoothAlgorithms.mqh library classes (must be copied to the terminal_data_folder\MQL5\Include). The use of the classes was thoroughly described in the article .
This indicator was first implemented in MQL4 and published in 15.02.2008.