i Cross AD
This professional-grade solution for MetaTrader 5 helps traders achieve greater efficiency in their daily workflow. This technical indicator acts as a specialized analysis tool designed to visualize market data. It helps traders identify emerging trends, momentum shifts, and key support or resistance levels by plotting statistical calculations directly onto price charts.
How to Setup and Use i Cross AD
1. Installation: Place your file in the MQL/Indicators folder via "Open Data Folder" and restart your terminal.
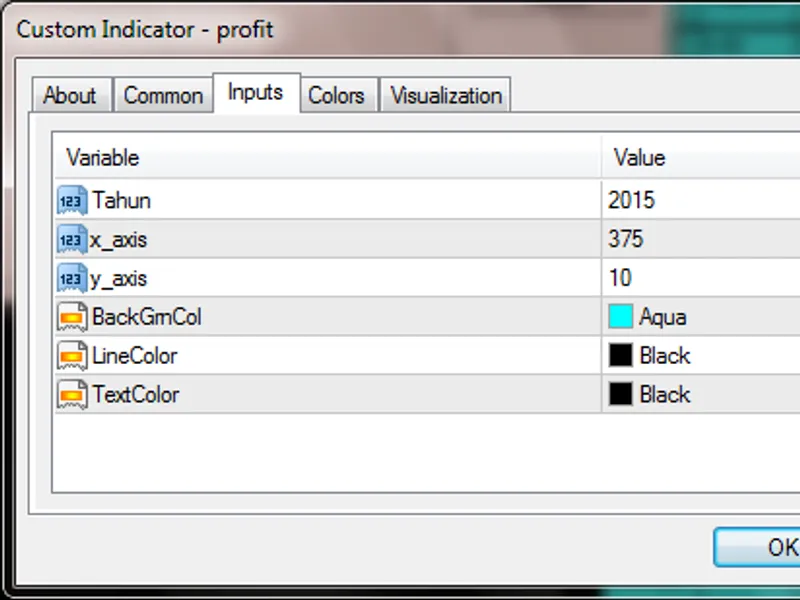
2. Loading: Find the indicator in the Navigator, drag it onto your chart, and configure the input parameters in the popup window.
3. Customization: Press Ctrl+I to open the indicator list, select your tool, and click "Properties" to change colors, levels, or visual styles.
4. Updating: Replace the old file in the Indicators folder with the new version and restart the platform to apply changes.
Frequently Asked Questions
Q: Why is my indicator not showing? A: Verify the file is in the MQL/Indicators folder, or try right-clicking the "Indicators" tree in the Navigator and clicking "Refresh."
Q: Do custom indicators slow down the platform? A: Too many complex indicators can impact performance; remove unused ones via the "Indicator List" (Ctrl+I).
Q: Can I use MT4 indicators on MT5? A: No, MQL4 and MQL5 are distinct languages; ensure the indicator is compiled specifically for your platform version.
Description & Settings
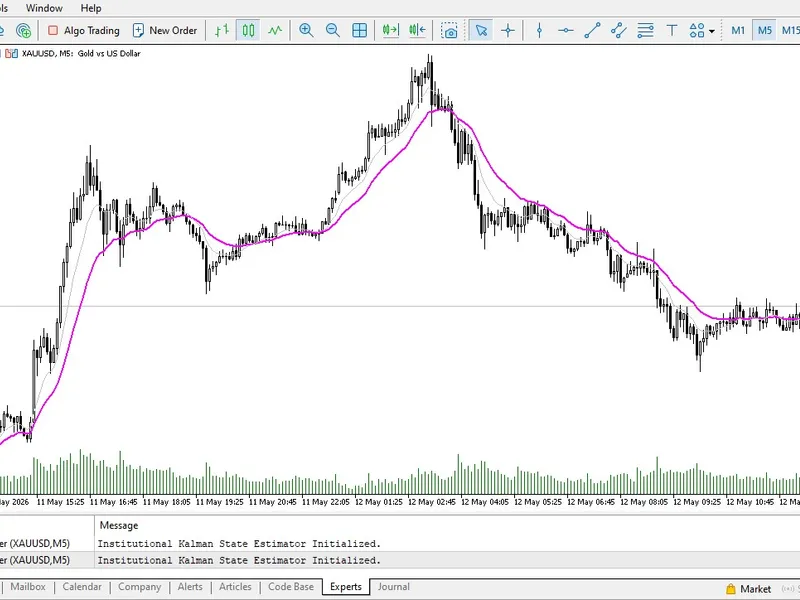
Indicator SCAD (iCrossAD). It shows possible reversals or price roll-backs. The indicator is based on the intersecting by A/D a trend line built on the extreme values of indicator A/D.
The indicator is based on the "MT4 signal function based on the Accumulation/Distribution (A/D) indicator" described in article ". Briefly: If a trend line built on the A/D indicator chart is crossed by the indicator line, then the price will most probably cross the trend line based on the price chart, too. Thus, upon a signal from the indicator, a reversal or a roll-back can be expected.
The indicator has twenty-three adjustable parameters:
AD applied volume
— volume used when calculating AD
Bars for calculate
— number of bars where the intersection is looked for.
Unchecked bars
— number of the last bars on the right, the intersection with which is not considered as a signal ("sensitivity" filter).
Filtering indicator
— filtering indicator
Without filtration
- without filtering on additional indicators
Filter by CCI
- filter on indicator CCI
Use setting by default CCI parameters
— if CCI is used for filtering the signals, then the Yes value allows using the CCI default settings.
CCI p
eriod
— CCI calculation period if default CCI settings are not used.
CCI a
ppled Price
— CCI calculation price if default CCI settings are not used.
The upper level of the filter indicator
— upper level of the filtering indicator.
The lower level of the filter indicator
— lower level of the filtering indicator.
Draws arrow on chart
— draw signal arrows on the price chart (Yes/No).
The size of the arrows on the chart
— size of signal arrows on the price chart.
Bullish arrows color
— color of bullish arrows.
Bearish arrows color
— color of bearish arrows.
Draw a trend line
— draw a trend line on the A/D indicator chart, intersections with which are searched for (Yes/No).
Trend line thickness
— thickness of the trend line.
Trend line style
— style of the trend line.
Downtrend line color
— color of the downtrend line.
Uptrend line color
— color of the uptrend line.
Draw the search area
— draw the area for searching the intersections (Yes/No).
Search area style
— drawing style of the search area
Fill
- filling
Frame
- frame
Search area line width (if Frame mode)
— line width of the search area (if drawing with a frame is selected).
Search area line style (if Frame mode)
— line style of the search area (if drawing with a frame is selected).
Search area color
— color of the search area line/filling.
Fig.1. SCAD, default settings
Fig. 2. SCAD, default settings. Draw a trend line = Yes, Draw the search area = Yes, Search area style = Fill