OH L C Candles with Ask and Bid
This professional-grade solution for MetaTrader 5 helps traders achieve greater efficiency in their daily workflow. This technical indicator acts as a specialized analysis tool designed to visualize market data. It helps traders identify emerging trends, momentum shifts, and key support or resistance levels by plotting statistical calculations directly onto price charts.
How to Setup and Use OH L C Candles with Ask and Bid
1. Installation: Place your file in the MQL/Indicators folder via "Open Data Folder" and restart your terminal.
2. Loading: Find the indicator in the Navigator, drag it onto your chart, and configure the input parameters in the popup window.
3. Customization: Press Ctrl+I to open the indicator list, select your tool, and click "Properties" to change colors, levels, or visual styles.
4. Updating: Replace the old file in the Indicators folder with the new version and restart the platform to apply changes.
Frequently Asked Questions
Q: Why is my indicator not showing? A: Verify the file is in the MQL/Indicators folder, or try right-clicking the "Indicators" tree in the Navigator and clicking "Refresh."
Q: Do custom indicators slow down the platform? A: Too many complex indicators can impact performance; remove unused ones via the "Indicator List" (Ctrl+I).
Q: Can I use MT4 indicators on MT5? A: No, MQL4 and MQL5 are distinct languages; ensure the indicator is compiled specifically for your platform version.
Description & Settings
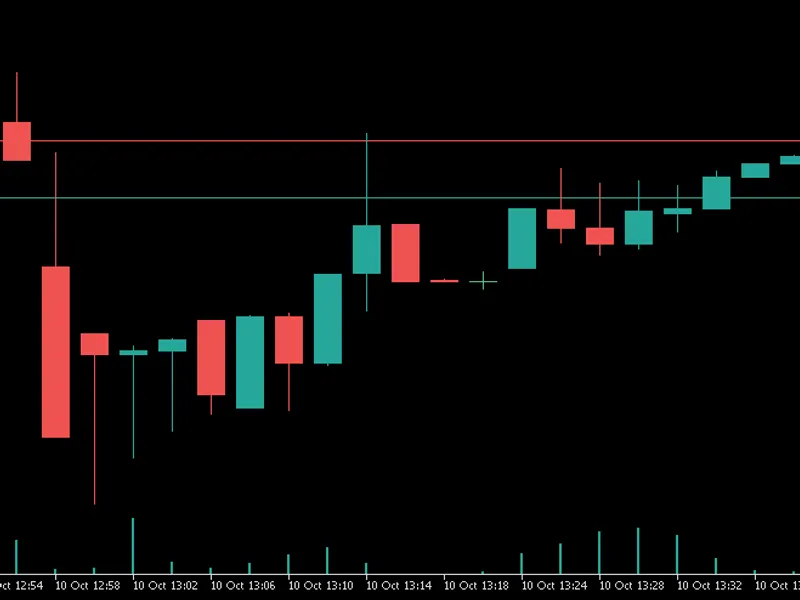
This is a candlestick chart which connects the high of the candle to the ask price if it is currently higher than the current high. The bid price is argued to always be the same as the close price, but it is also included in the logic either way so that the low of the candle connects to the bid price if it is ever lower.
The ask price is always higher than the bid so it makes sense to connect the candles to the ask and bid this way, and it leaves no prices and spreads hidden. The ask line can always be activated on the chart, but ask prices are more tangible if they are seen this way.
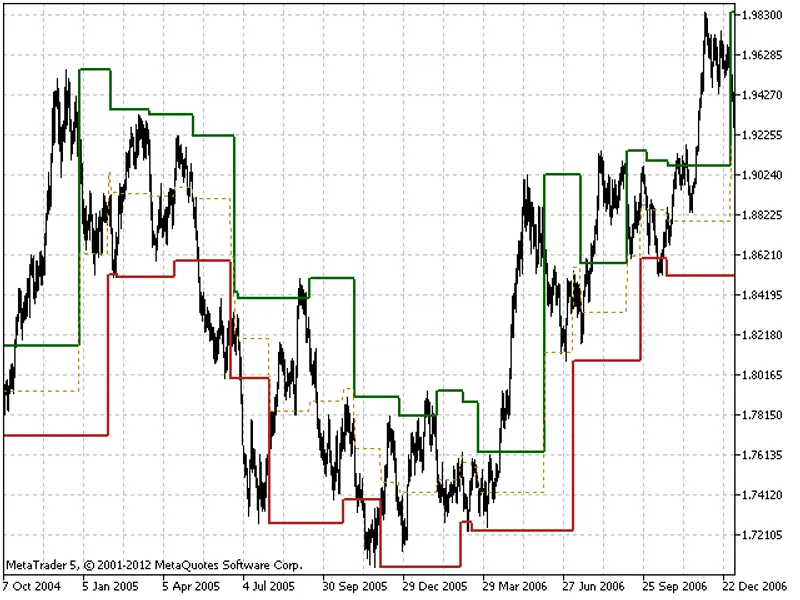
Normal OHLC chart:
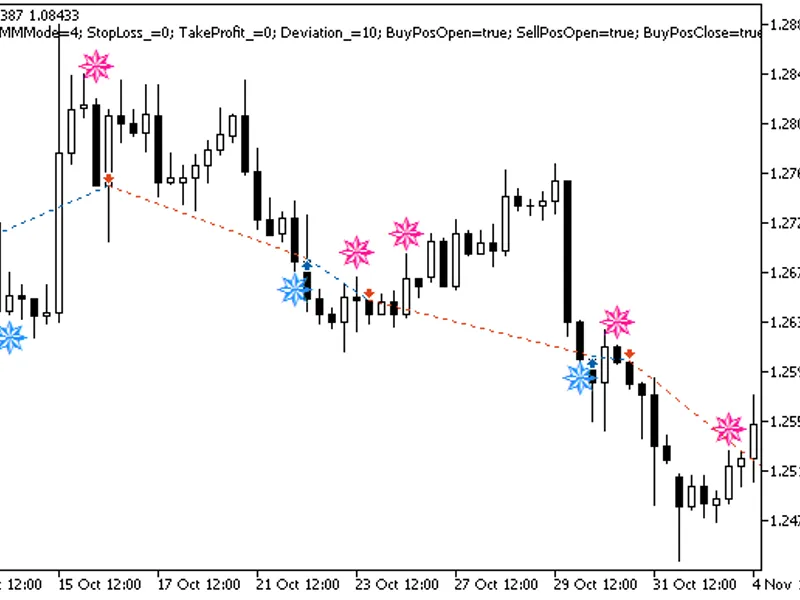
OHLC with ask and bid: