Engulfing Stochastic
This professional-grade solution for MetaTrader 5 helps traders achieve greater efficiency in their daily workflow. This technical indicator acts as a specialized analysis tool designed to visualize market data. It helps traders identify emerging trends, momentum shifts, and key support or resistance levels by plotting statistical calculations directly onto price charts.
How to Setup and Use Engulfing Stochastic
1. Installation: Place your file in the MQL/Indicators folder via "Open Data Folder" and restart your terminal.
2. Loading: Find the indicator in the Navigator, drag it onto your chart, and configure the input parameters in the popup window.
3. Customization: Press Ctrl+I to open the indicator list, select your tool, and click "Properties" to change colors, levels, or visual styles.
4. Updating: Replace the old file in the Indicators folder with the new version and restart the platform to apply changes.
Frequently Asked Questions
Q: Why is my indicator not showing? A: Verify the file is in the MQL/Indicators folder, or try right-clicking the "Indicators" tree in the Navigator and clicking "Refresh."
Q: Do custom indicators slow down the platform? A: Too many complex indicators can impact performance; remove unused ones via the "Indicator List" (Ctrl+I).
Q: Can I use MT4 indicators on MT5? A: No, MQL4 and MQL5 are distinct languages; ensure the indicator is compiled specifically for your platform version.
Description & Settings
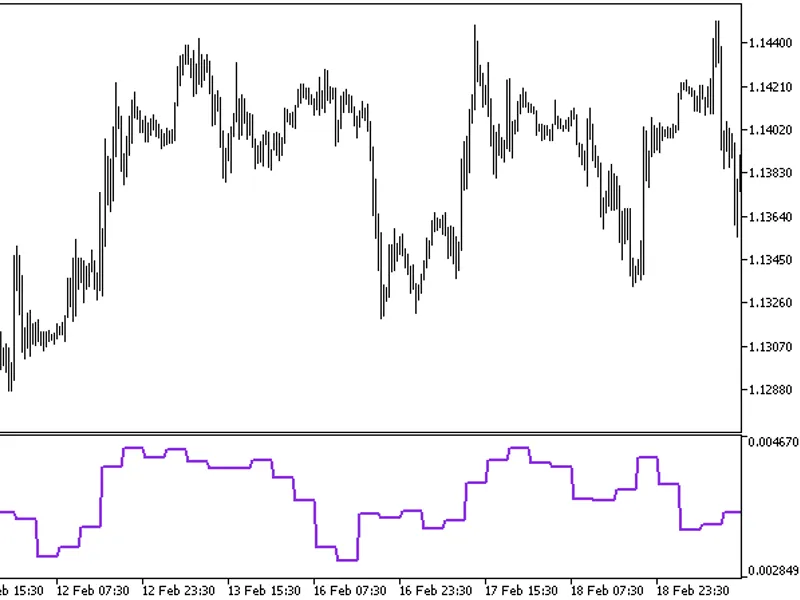
We have all seen a currency pair enter the overbought or oversold territory and stay there for long periods of time. What this indicator does is gives you the emphasis. So if you are looking for reversals then you may want to take notice when oversold territory is entered into with a bullish engulfing candle or if the trend is your thing then check for bearish engulfing candles while entering oversold.
This indicator will show a downward arrow when it detects a bearish engulfing candle while crossing over an overbought or oversold line. It will show an upward arrow if it detects a bullish candle while crossing the overbought or oversold line. A cross of the overbought or oversold line is made when the signal line of the stochastic crosses the line. If in the case of an overbought cross the signal line of stochastic was below the overbought and then crosses above it that is a valid cross, crosses in the other direction are ignored. It is similar, but opposite, for the oversold, the signal line must cross from above to below the oversold level.
Interesting Inputs:
OverSold level for defining the oversold level
OverBought level for defining overbought
symbol enter a symbol name here if you don't want to use the symbol that the chart is attached to.
The timeframe is used to select periods that are possibly different from the one that the chart is attached to base the indicator on.
More info on blog post at