Variation Index
This software component for MetaTrader 5 is built to enhance the capabilities of your trading environment. This technical indicator acts as a specialized analysis tool designed to visualize market data. It helps traders identify emerging trends, momentum shifts, and key support or resistance levels by plotting statistical calculations directly onto price charts.
How to Setup and Use Variation Index
1. Installation: Place your file in the MQL/Indicators folder via "Open Data Folder" and restart your terminal.
2. Loading: Find the indicator in the Navigator, drag it onto your chart, and configure the input parameters in the popup window.
3. Customization: Press Ctrl+I to open the indicator list, select your tool, and click "Properties" to change colors, levels, or visual styles.
4. Updating: Replace the old file in the Indicators folder with the new version and restart the platform to apply changes.
Frequently Asked Questions
Q: Why is my indicator not showing? A: Verify the file is in the MQL/Indicators folder, or try right-clicking the "Indicators" tree in the Navigator and clicking "Refresh."
Q: Do custom indicators slow down the platform? A: Too many complex indicators can impact performance; remove unused ones via the "Indicator List" (Ctrl+I).
Q: Can I use MT4 indicators on MT5? A: No, MQL4 and MQL5 are distinct languages; ensure the indicator is compiled specifically for your platform version.
Description & Settings
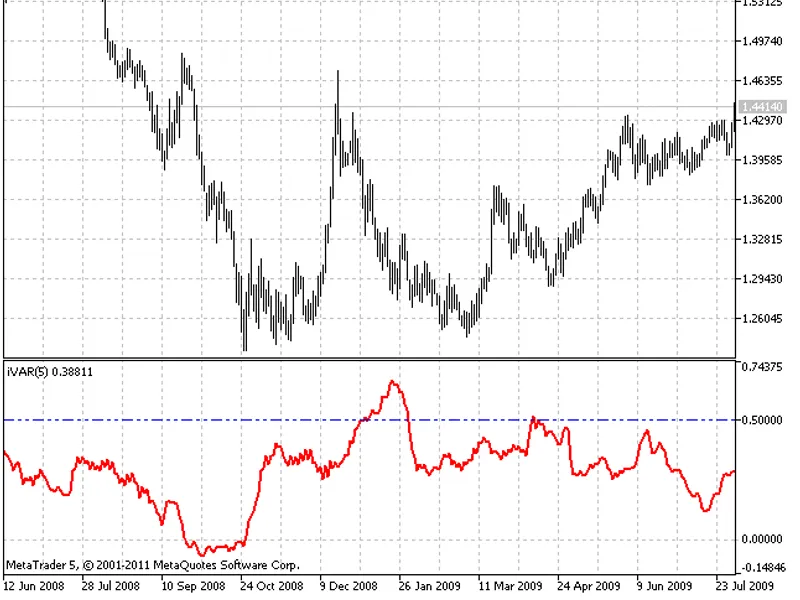
Variation Index shows if a trend or a flat movement is prevailing in the time series or random behaviour.
Nowadays, the most popular representatives of the fractal time functions are the financial time series. The fractal structure of these series is well-known and aсcording to Mandelbrot is a "theoretical reformulation of a down-to-earth bit of market folklore-namely, that movements of a stock or currency all look alike when a market chart is enlarged or reduced so that it 5ts the same time and price scale" [1].
Usually, to determine the fractal dimension the Hurst's exponent is calculated [2]. However, for the reliable calculation of this exponent a huge amount of data is necesary (~ 10^3) and that is too much comparing to the duration of the trends of trading.
The suggested indicator calculates the variation index on a previous interval which is 2^n long. The "n" parameter is specified by the user.
The common rules of the indicator application are the following:
If the value of the indicator is lower than 0.5, it means the trend state of the market.
The extremely low value is often precedes the end (correction) of the current trend.
If the value of the indicator is higher than 0.5, it means the flat state of the market.
The extremely high value is often precedes the beginning of the considerable trends.
If the value of the indicator is close to 0.5, it means an undefined state of the market.This indicator was first implemented in MQL4 and published in 06.10.2008.
References