Ultra XM A
This software component for MetaTrader 5 is built to enhance the capabilities of your trading environment. This technical indicator acts as a specialized analysis tool designed to visualize market data. It helps traders identify emerging trends, momentum shifts, and key support or resistance levels by plotting statistical calculations directly onto price charts.
How to Setup and Use Ultra XM A
1. Installation: Place your file in the MQL/Indicators folder via "Open Data Folder" and restart your terminal.
2. Loading: Find the indicator in the Navigator, drag it onto your chart, and configure the input parameters in the popup window.
3. Customization: Press Ctrl+I to open the indicator list, select your tool, and click "Properties" to change colors, levels, or visual styles.
4. Updating: Replace the old file in the Indicators folder with the new version and restart the platform to apply changes.
Frequently Asked Questions
Q: Why is my indicator not showing? A: Verify the file is in the MQL/Indicators folder, or try right-clicking the "Indicators" tree in the Navigator and clicking "Refresh."
Q: Do custom indicators slow down the platform? A: Too many complex indicators can impact performance; remove unused ones via the "Indicator List" (Ctrl+I).
Q: Can I use MT4 indicators on MT5? A: No, MQL4 and MQL5 are distinct languages; ensure the indicator is compiled specifically for your platform version.
Description & Settings
This indicator is based on the integral value of the trend from the fans of similar moving averages with an arithmetic progression of the smoothing period.
Moving averages calculation algorithm is as follows. We have indicator input parameters as source data:
StartLength - minimum initial value of the first signal line;
Step - period change step;
StepsTotal - number of period changes.
Any period value from the multitude of the lines fan is calculated using arithmetic progression:
where the value of Number variable ranges from zero to StepsTotal. Obtained values of the periods are added to the variables array and are used at each indicator tick to get the array of XMA moving averages fan values. Directions of the current trend for each of the smoothings are calculated and also the number of positive and negative trends for the whole array of moving averages fan values. The final number of positive and negative trends is smoothed in its turn and used as the indicator lines that form a color cloud displayed with the help of the style class.
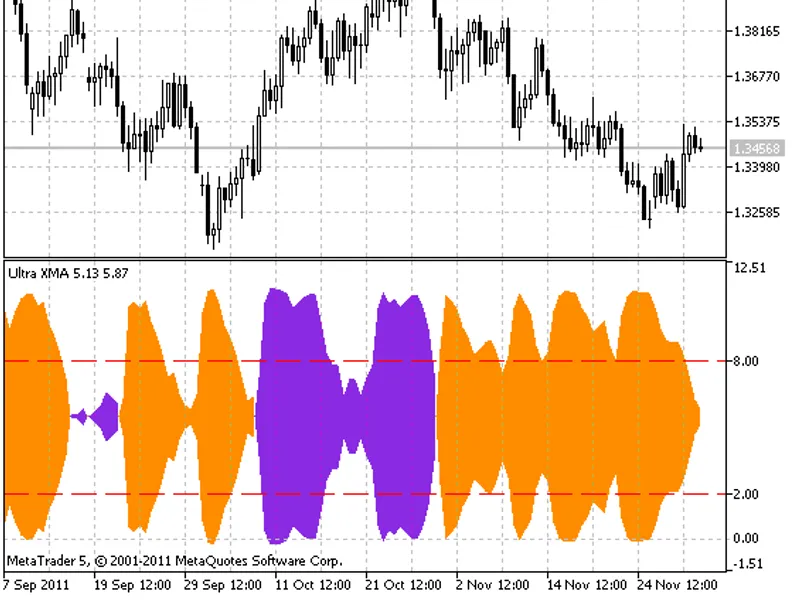
A trend direction in this indicator is determined by the cloud color, while its power is determined by the cloud width. You can use the overbought (UpLevel) and oversold (DnLevel) levels that are set in percent value from the indicator maximum amplitude.
- simple moving average;
- exponential moving average;
- smoothed moving average;
- linear weighted moving average;
- JMA adaptive average;
- ultralinear smoothing;
- parabolic smoothing;
- Tillson's multiple exponential smoothing;
- smoothing with the use of Tushar Chande's algorithm;
- smoothing with the use of Perry Kaufman's algorithm.
It should be noted that Phase parameters for different smoothing algorithms have completely different meaning. For JMA it is an external Phase variable changing from -100 to +100. For T3 it is a smoothing ratio multiplied by 100 for better visualization, for VIDYA it is a CMO oscillator period and for AMA it is a slow EMA period. In other algorithms these parameters do not affect smoothing. For AMA fast EMA period is a fixed value and is equal to 2 by default. The ratio of raising to the power is also equal to 2 for AMA.
The indicator uses SmoothAlgorithms.mqh library classes (must be copied to the terminal_data_folder\MQL5\Include). The use of the classes was thoroughly described in the article .
Indicator input parameters: