Trend Linear Reg
This is a powerful addition to your MetaTrader 5 toolkit designed to optimize market analysis and performance. This technical indicator acts as a specialized analysis tool designed to visualize market data. It helps traders identify emerging trends, momentum shifts, and key support or resistance levels by plotting statistical calculations directly onto price charts.
How to Setup and Use Trend Linear Reg
1. Installation: Place your file in the MQL/Indicators folder via "Open Data Folder" and restart your terminal.
2. Loading: Find the indicator in the Navigator, drag it onto your chart, and configure the input parameters in the popup window.
3. Customization: Press Ctrl+I to open the indicator list, select your tool, and click "Properties" to change colors, levels, or visual styles.
4. Updating: Replace the old file in the Indicators folder with the new version and restart the platform to apply changes.
Frequently Asked Questions
Q: Why is my indicator not showing? A: Verify the file is in the MQL/Indicators folder, or try right-clicking the "Indicators" tree in the Navigator and clicking "Refresh."
Q: Do custom indicators slow down the platform? A: Too many complex indicators can impact performance; remove unused ones via the "Indicator List" (Ctrl+I).
Q: Can I use MT4 indicators on MT5? A: No, MQL4 and MQL5 are distinct languages; ensure the indicator is compiled specifically for your platform version.
Description & Settings
Sergej Solujanov
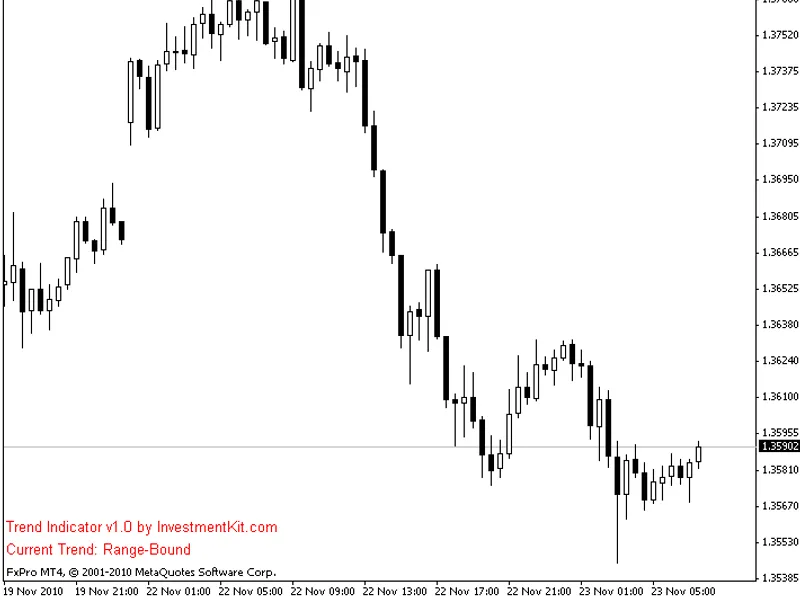
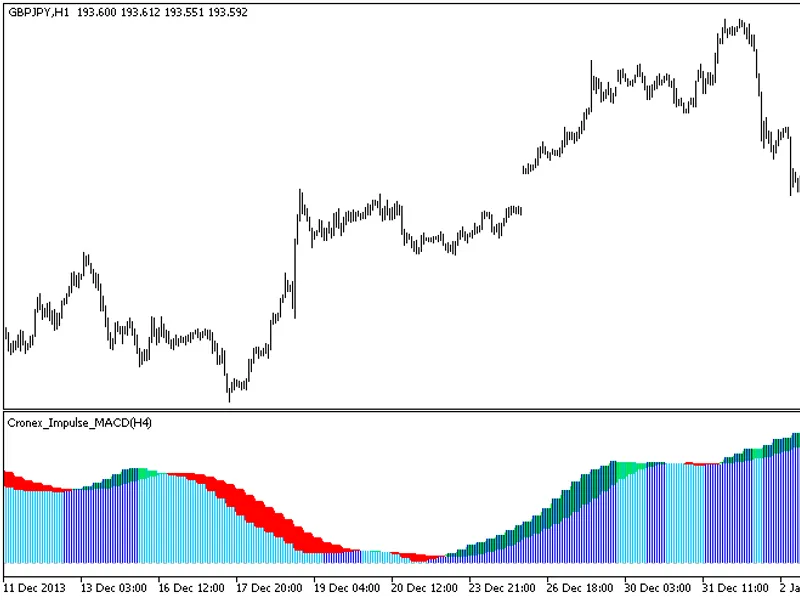
A smooth non-normalized oscillator implemented in the form of a color histogram.
How does trend change? How to select flat? How to trade? ... etc.
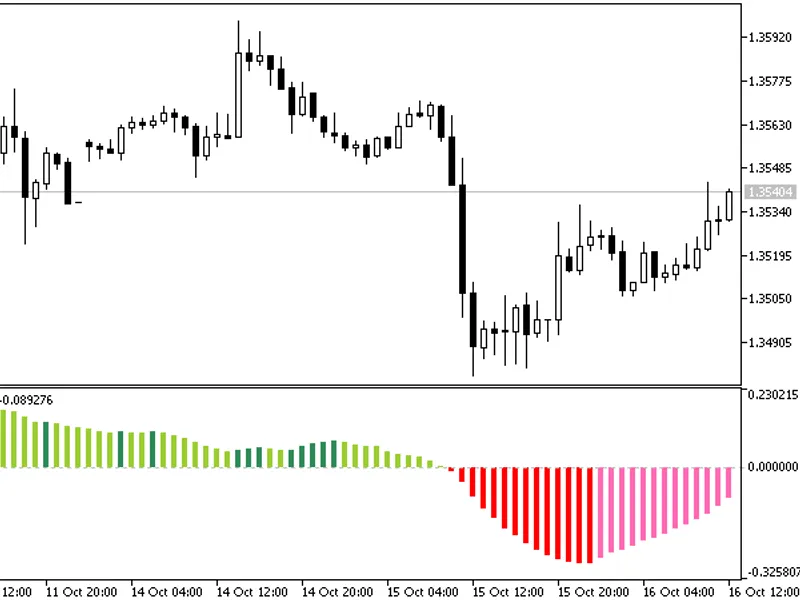
If we assume that the trend of N bars is a straight line, we can calculate the parameters of this line. Equation of the line is y = bx + c. The line slope is characterized by the "b" coefficient. The indicator calculates this parameter by linear regression for every bar and displays it in a separate window. Color green shows that the value that is greater than the previous one, i.e. the angle increases, the red means just the opposite.
In fact, in relation to charts, the "b" coefficient is derived from two factors - from the tangent of the angle line and the coefficient that characterizes the pair, so the scale of the indicator values is different for different pairs.
How to use the indicator? In my opinion, there are several options:
Crossing the zero line;
Touching the maximum value;
If you set a certain area around the zero line as a flat, you can trade at the breakthrough of the zone.
Fig. 1. The TrendLinearReg indicator