Price and Volume Trend - PV T
This professional-grade solution for MetaTrader 4 helps traders achieve greater efficiency in their daily workflow. This technical indicator acts as a specialized analysis tool designed to visualize market data. It helps traders identify emerging trends, momentum shifts, and key support or resistance levels by plotting statistical calculations directly onto price charts.
How to Setup and Use Price and Volume Trend - PV T
1. Installation: Place your file in the MQL/Indicators folder via "Open Data Folder" and restart your terminal.
2. Loading: Find the indicator in the Navigator, drag it onto your chart, and configure the input parameters in the popup window.
3. Customization: Press Ctrl+I to open the indicator list, select your tool, and click "Properties" to change colors, levels, or visual styles.
4. Updating: Replace the old file in the Indicators folder with the new version and restart the platform to apply changes.
Frequently Asked Questions
Q: Why is my indicator not showing? A: Verify the file is in the MQL/Indicators folder, or try right-clicking the "Indicators" tree in the Navigator and clicking "Refresh."
Q: Do custom indicators slow down the platform? A: Too many complex indicators can impact performance; remove unused ones via the "Indicator List" (Ctrl+I).
Q: Can I use MT4 indicators on MT5? A: No, MQL4 and MQL5 are distinct languages; ensure the indicator is compiled specifically for your platform version.
Description & Settings
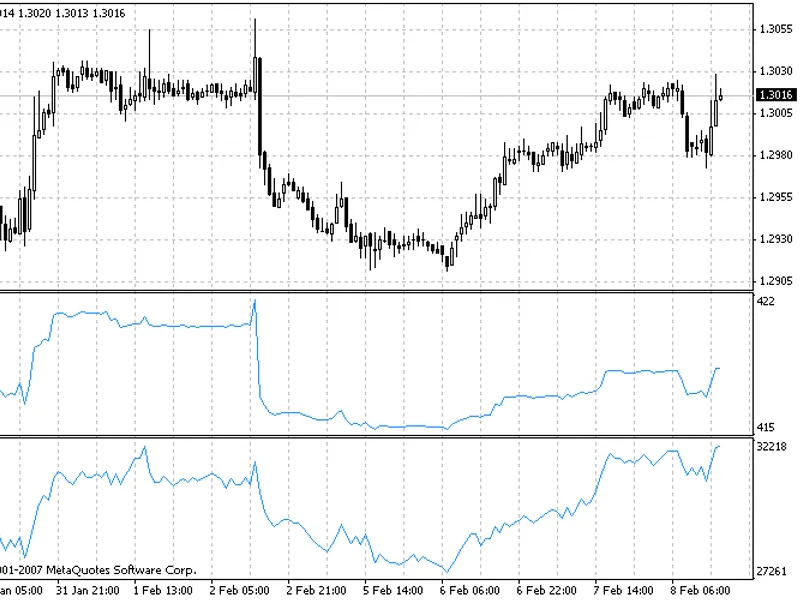
Indicator Price and Volume Trend (PVT), like On Balance Volume (OBV), represents the cumulative sum of trade volumes calculated considering close price changes.
The calculation algorithm is close to that of the indicator OBV. But in OBV we add the whole daily volume to the current indicator value when close prices are higher, and detract the whole volume when close prices are lower, while in PVT we add or detract just a part of daily volume. The exact part of the volume to be added to PVT is determined by the value of price change relatively to the close price of the previous day.
In OBV, the cumulative total volumes for each period are summed. However, in PVT, the volume is multiplied by the coefficient that depends on the difference between the current close price and the previous one. The picture below shows that the behaviors of both indicators are quite correlated: