Timeframe Quality Analyzer
This professional-grade solution for MetaTrader 5 helps traders achieve greater efficiency in their daily workflow. This technical indicator acts as a specialized analysis tool designed to visualize market data. It helps traders identify emerging trends, momentum shifts, and key support or resistance levels by plotting statistical calculations directly onto price charts.
How to Setup and Use Timeframe Quality Analyzer
1. Installation: Place your file in the MQL/Indicators folder via "Open Data Folder" and restart your terminal.
2. Loading: Find the indicator in the Navigator, drag it onto your chart, and configure the input parameters in the popup window.
3. Customization: Press Ctrl+I to open the indicator list, select your tool, and click "Properties" to change colors, levels, or visual styles.
4. Updating: Replace the old file in the Indicators folder with the new version and restart the platform to apply changes.
Frequently Asked Questions
Q: Why is my indicator not showing? A: Verify the file is in the MQL/Indicators folder, or try right-clicking the "Indicators" tree in the Navigator and clicking "Refresh."
Q: Do custom indicators slow down the platform? A: Too many complex indicators can impact performance; remove unused ones via the "Indicator List" (Ctrl+I).
Q: Can I use MT4 indicators on MT5? A: No, MQL4 and MQL5 are distinct languages; ensure the indicator is compiled specifically for your platform version.
Description & Settings
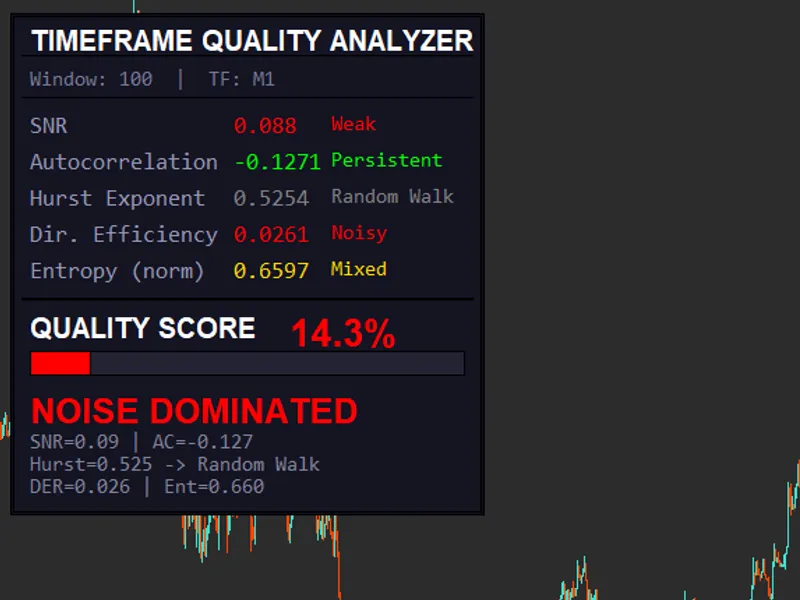
This indicator tests if a timeframe is tradeable by checking
1. Signal-to-Noise Ratio (SNR)
Fit a linear regression over a rolling window of N bars.
Compute:
Explained variance (trend component)
Residual variance (noise component)
SNR = Explained Variance / Residual Variance
2. Autocorrelation (Memory Test)
Compute autocorrelation of returns for lag=1 over rolling window.
Display value.
Color code:
Green if > 0.1 (persistence)
Red if near 0 (noise)
3. Hurst Exponent (Fractal Memory)
Interpret:
H ≈ 0.5 → random walk
H > 0.55 → trending
H < 0.45 → mean reverting
4. Volatility Clustering (Variance Stability)
Display as oscillator between 0 and 1.
5. Shannon Entropy (Randomness Test)
Discretize returns into bins.
Compute Shannon entropy:
H = - Σ p(x) log(p(x))
Normalize between 0 and 1.
Higher entropy = more randomness.
BEST INPUT SETTINGS A. Default Balanced (Recommended Start) Why:
Larger window → reduces noise
Higher SNR weight → trend detection
Lower AC → autocorrelation is unstable
B. Trend Following Mode (Best for Breakouts) Use when:
Market trending strongly
Trading breakout / momentum
Focus:
trend + persistence C. Scalping / Intraday Mode Use when:
M1–M15 trading
Need fast adaptation
Focus:
structure + efficiency D. Anti-Chop Filter Mode (VERY POWERFUL) Use when:
You want to
avoid bad market conditions
High entropy weight = avoid noise