Support Vector Machine Indicator
This software component for MetaTrader 5 is built to enhance the capabilities of your trading environment. This technical indicator acts as a specialized analysis tool designed to visualize market data. It helps traders identify emerging trends, momentum shifts, and key support or resistance levels by plotting statistical calculations directly onto price charts.
How to Setup and Use Support Vector Machine Indicator
1. Installation: Place your file in the MQL/Indicators folder via "Open Data Folder" and restart your terminal.
2. Loading: Find the indicator in the Navigator, drag it onto your chart, and configure the input parameters in the popup window.
3. Customization: Press Ctrl+I to open the indicator list, select your tool, and click "Properties" to change colors, levels, or visual styles.
4. Updating: Replace the old file in the Indicators folder with the new version and restart the platform to apply changes.
Frequently Asked Questions
Q: Why is my indicator not showing? A: Verify the file is in the MQL/Indicators folder, or try right-clicking the "Indicators" tree in the Navigator and clicking "Refresh."
Q: Do custom indicators slow down the platform? A: Too many complex indicators can impact performance; remove unused ones via the "Indicator List" (Ctrl+I).
Q: Can I use MT4 indicators on MT5? A: No, MQL4 and MQL5 are distinct languages; ensure the indicator is compiled specifically for your platform version.
Description & Settings
The process adopted by this indicator is as follows:
Select what indicators are to be used as inputs for the support vector machine.
Collect historical indicator and price data for the current symbol.
Use this historical data to determine what trades would have been successful if they had been taken.
Feed this data to the support vector machine and use it for training.
Use the trained support vector machine to signal future trades.
This indicator uses the Support Vector Machine Learning Library available from the metaquotes market place to achieve support vector machine functionality.
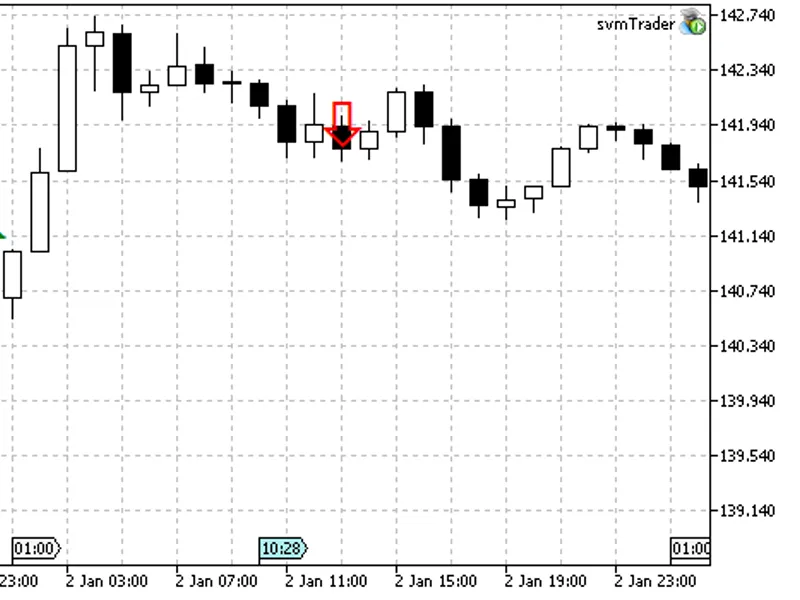
When the custom indicator is first attached to the chart, it populates the chart with historical buy/sell trades that would have been successful. It is these data points that are used to train the support vector machine, then on any bar thereafter the indicator uses the model produced by the trained support vector machine to predict any future trades.
This is a simple indicator used to demonstrate how support vector machines can assist in signalling trades. I recommend you optimize inputs used for the support vector machine to maximise your results. Some examples components you may wish to modify are:
The number of inputs used (this can theoretically be from one to infinity)
The indicator types (this can be any built-in/custom indicator)
The offset in indicator data (this can be changed to allow passing in a snapshot of an indicator i.e. the past 5 bars)
The number of Training Points to be used.


![Schnick [Support Vector Machine Learning Tool Tester - DE M O]](/images/1370.webp)


