Stochastic RV I
This is a powerful addition to your MetaTrader 5 toolkit designed to optimize market analysis and performance. This technical indicator acts as a specialized analysis tool designed to visualize market data. It helps traders identify emerging trends, momentum shifts, and key support or resistance levels by plotting statistical calculations directly onto price charts.
How to Setup and Use Stochastic RV I
1. Installation: Place your file in the MQL/Indicators folder via "Open Data Folder" and restart your terminal.
2. Loading: Find the indicator in the Navigator, drag it onto your chart, and configure the input parameters in the popup window.
3. Customization: Press Ctrl+I to open the indicator list, select your tool, and click "Properties" to change colors, levels, or visual styles.
4. Updating: Replace the old file in the Indicators folder with the new version and restart the platform to apply changes.
Frequently Asked Questions
Q: Why is my indicator not showing? A: Verify the file is in the MQL/Indicators folder, or try right-clicking the "Indicators" tree in the Navigator and clicking "Refresh."
Q: Do custom indicators slow down the platform? A: Too many complex indicators can impact performance; remove unused ones via the "Indicator List" (Ctrl+I).
Q: Can I use MT4 indicators on MT5? A: No, MQL4 and MQL5 are distinct languages; ensure the indicator is compiled specifically for your platform version.
Description & Settings
Witold Wozniak
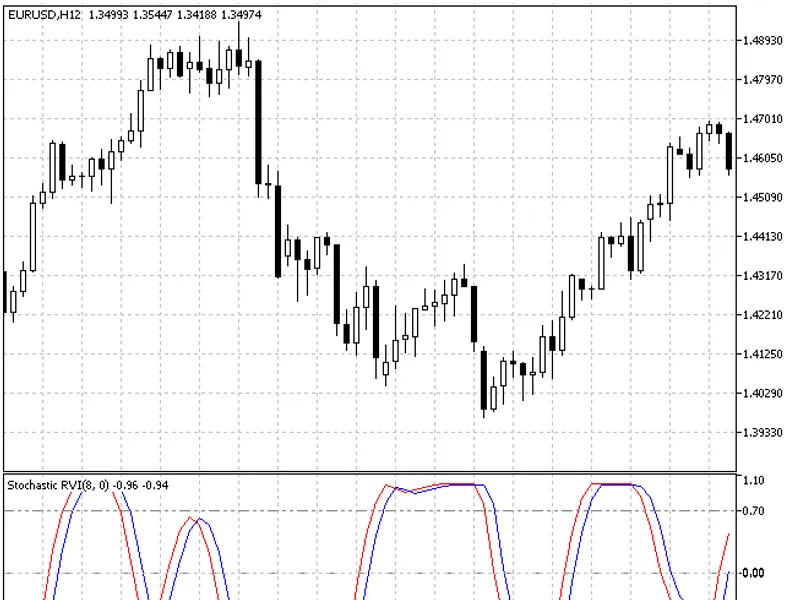
Stochastic RVI is a standard applied to the values of (Relative Vigor Index) indicator instead of a price.
Standard Stochastic oscillator is not so effective in marking the changes of market cycles or volatility. It uses a fixed period and does not fit into constantly changing market cycle length. Stochastic RVI indicator does not have such a problem and fits into the current market volatility.
The indicator is inspired by John Ehlers' article published in November 2002 in the magazine. The simplest trading system for this indicator is equivalent to the one used with Stochastic Oscillator or RVI: main/signal lines crossover, zero line breakout, enter and exit to the overbought and oversold areas, the indicator divergencies with a price chart.