Bollinger Bands Crossover Signals
This tool for MetaTrader 5 is specifically engineered to streamline your trading operations. This technical indicator acts as a specialized analysis tool designed to visualize market data. It helps traders identify emerging trends, momentum shifts, and key support or resistance levels by plotting statistical calculations directly onto price charts.
How to Setup and Use Bollinger Bands Crossover Signals
1. Installation: Place your file in the MQL/Indicators folder via "Open Data Folder" and restart your terminal.
2. Loading: Find the indicator in the Navigator, drag it onto your chart, and configure the input parameters in the popup window.
3. Customization: Press Ctrl+I to open the indicator list, select your tool, and click "Properties" to change colors, levels, or visual styles.
4. Updating: Replace the old file in the Indicators folder with the new version and restart the platform to apply changes.
Frequently Asked Questions
Q: Why is my indicator not showing? A: Verify the file is in the MQL/Indicators folder, or try right-clicking the "Indicators" tree in the Navigator and clicking "Refresh."
Q: Do custom indicators slow down the platform? A: Too many complex indicators can impact performance; remove unused ones via the "Indicator List" (Ctrl+I).
Q: Can I use MT4 indicators on MT5? A: No, MQL4 and MQL5 are distinct languages; ensure the indicator is compiled specifically for your platform version.
Description & Settings
Overview
This custom indicator combines
Bollinger Bands
with clear
Buy/Sell arrows
on the chart.It automatically detects when the price
crosses above the lower band
or
below the upper band
and plots arrows accordingly.The goal is to help traders quickly identify
potential reversal points
at the edges of market volatility.
How It Works
The indicator calculates
Bollinger Bands
using the built-in iBands function.
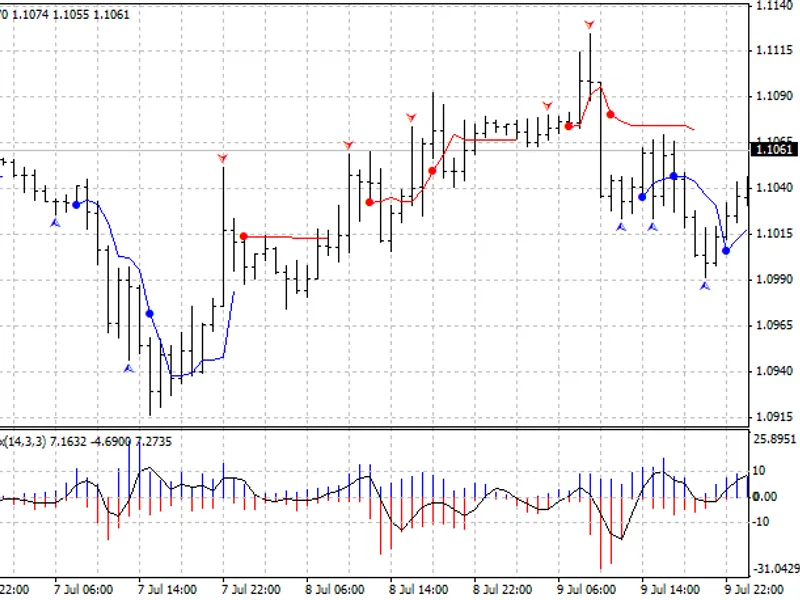
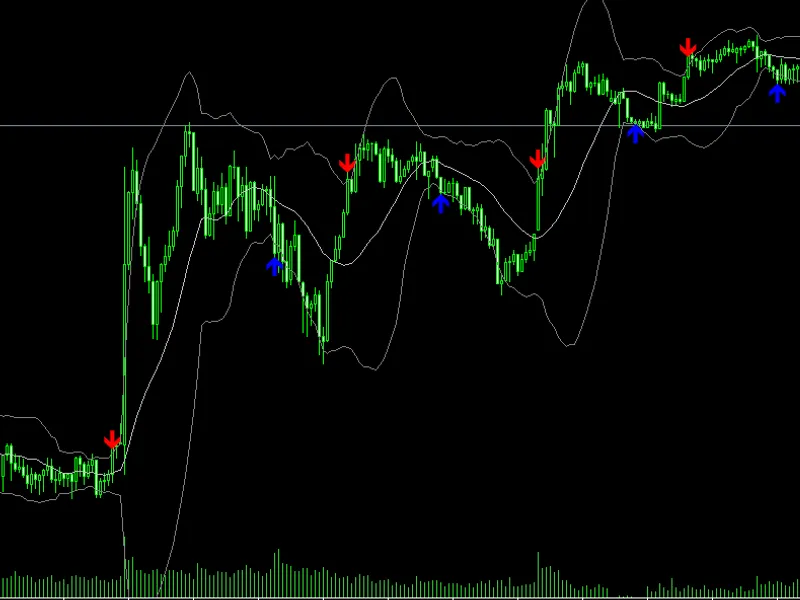
Buy Signal (Blue Arrow)
→ when the price closes
below the lower band
on the previous candle, then closes
above it
on the next candle.
Sell Signal (Red Arrow)
→ when the price closes
above the upper band
on the previous candle, then closes
below it
on the next candle.
Signals appear
only once per direction
until an opposite signal is triggered, avoiding repeated arrows in the same move.
The
Bollinger Bands
can be displayed or hidden according to user preference.
Indicator Features
Clear Buy/Sell Arrows
directly on the chart.
Optional display
of Upper, Middle, and Lower Bollinger Bands.
Works on
all symbols
and
timeframes
.
Uses
non-repainting
logic (signals are confirmed after candle close).
Easy to customize parameters.
Input Parameters
Usage Example
Attach
the indicator to your chart.
Set
BB_Period
and
BB_Deviation
according to your trading style.
Watch for
blue arrows
near the lower band (potential buys) and
red arrows
near the upper band (potential sells).
Combine with other confirmations such as
trend filters
or
candlestick patterns
for higher accuracy.
Trading Tips
Works well in
sideways or ranging markets
where price often touches Bollinger Bands.
In
strong trending markets
, consider using it with a trend filter (e.g., moving averages) to avoid counter-trend signals.
Always test settings on your preferred symbol and timeframe.
Screenshot
📜 Disclaimer
This indicator is a
technical analysis tool
and does not guarantee profits.Use it together with proper
risk management
and other trading strategies.