Sidus
This is a powerful addition to your MetaTrader 5 toolkit designed to optimize market analysis and performance. This technical indicator acts as a specialized analysis tool designed to visualize market data. It helps traders identify emerging trends, momentum shifts, and key support or resistance levels by plotting statistical calculations directly onto price charts.
How to Setup and Use Sidus
1. Installation: Place your file in the MQL/Indicators folder via "Open Data Folder" and restart your terminal.
2. Loading: Find the indicator in the Navigator, drag it onto your chart, and configure the input parameters in the popup window.
3. Customization: Press Ctrl+I to open the indicator list, select your tool, and click "Properties" to change colors, levels, or visual styles.
4. Updating: Replace the old file in the Indicators folder with the new version and restart the platform to apply changes.
Frequently Asked Questions
Q: Why is my indicator not showing? A: Verify the file is in the MQL/Indicators folder, or try right-clicking the "Indicators" tree in the Navigator and clicking "Refresh."
Q: Do custom indicators slow down the platform? A: Too many complex indicators can impact performance; remove unused ones via the "Indicator List" (Ctrl+I).
Q: Can I use MT4 indicators on MT5? A: No, MQL4 and MQL5 are distinct languages; ensure the indicator is compiled specifically for your platform version.
Description & Settings
GwadaTradeBoy
"Sidus Method" trading strategy algorithm:
The best advantage of Sidus Method is that you don't have to add any additional filters. The losses are possible when using this method, but they are not often. This strategy makes Forex trading quite profitable, its idea is very easy to understand, easy to find market entry points and open a position.
"Sidus Method" strategy main parameters:
Currency pairs: EUR/GBP and EUR/USD. Other pairs are also possible but the method was tested using mentioned ones;
Time interval - Н1 (or M30, though false signals are more probable when using this interval);
: 18 ЕМА and 28 ЕМА;
- 5 WMA and 8 WMA.
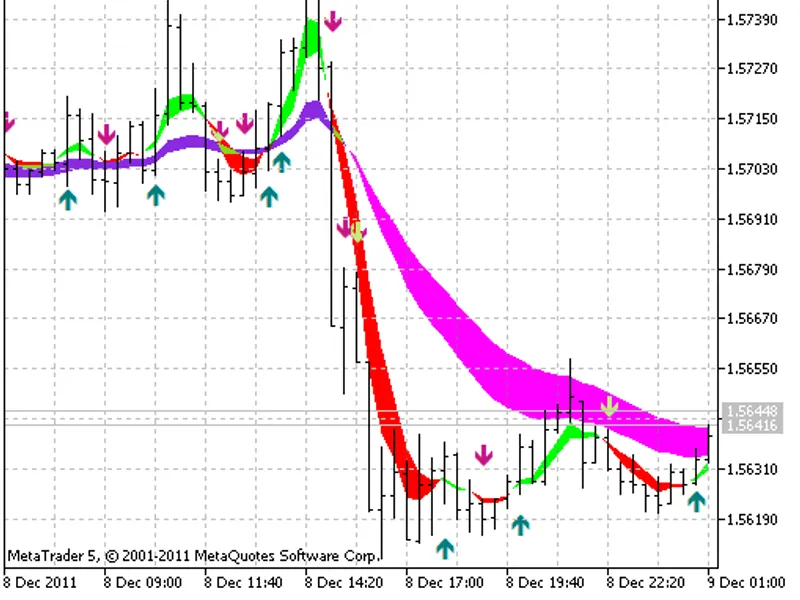
18 ЕМА and 28 ЕМА moving averages are the two moving lines that form a tunnel. This feature can help you find and identify the beginning and the end of a long-term trend. 5 WMA and 8 WMA will show you where to enter the market in the direction of a trend as well as help you evaluate the power of a short-term trend.
Market entry signals according to the "Sidus Method"
:
We should open a position only when the tunnel is very narrow or intertwined:
Opening a buy position: 5 WMA and 8 WMA moving averages cross the tunnel upwards. Besides, if you notice that 5 WMA also crosses 8 WMA upwards, then the signal is very strong!
Opening a sell position: 5 WMA and 8 WMA moving averages cross the tunnel downwards. Besides, if you notice that 5 WMA also crosses 8 WMA downwards, then it is also a very good signal for entering the market.
Trading signals for market exit indicating the end of a trend according to "Sidus Method"
:
Buy signal: a price on a chart has reached a top and 5 WMA "dives" under 8 WMA. It is time to close a position.
Sell signal: a price on a chart has reached a bottom and 5 WMA "jumps" over 8WMA. It is time to close a position.
Also, ALWAYS close your position as soon as the tunnel borders start overlapping or when they converge and become similar to one moving average. This is a very good sign of the current trend change. If you noticed that, you should close your open position and open a new one in the opposite direction. Stay on alert in case you have an open position and 5 WMA and 8 WMA are crossing the tunnel. If the tunnel borders has not yet intersected, then everything is fine, but in most cases this is the first sign that they will meet each other soon. So, get ready to close your position.
This indicator was first implemented in MQL4 and published in 25.10.2007.