Sidus Cloud
This tool for MetaTrader 5 is specifically engineered to streamline your trading operations. This technical indicator acts as a specialized analysis tool designed to visualize market data. It helps traders identify emerging trends, momentum shifts, and key support or resistance levels by plotting statistical calculations directly onto price charts.
How to Setup and Use Sidus Cloud
1. Installation: Place your file in the MQL/Indicators folder via "Open Data Folder" and restart your terminal.
2. Loading: Find the indicator in the Navigator, drag it onto your chart, and configure the input parameters in the popup window.
3. Customization: Press Ctrl+I to open the indicator list, select your tool, and click "Properties" to change colors, levels, or visual styles.
4. Updating: Replace the old file in the Indicators folder with the new version and restart the platform to apply changes.
Frequently Asked Questions
Q: Why is my indicator not showing? A: Verify the file is in the MQL/Indicators folder, or try right-clicking the "Indicators" tree in the Navigator and clicking "Refresh."
Q: Do custom indicators slow down the platform? A: Too many complex indicators can impact performance; remove unused ones via the "Indicator List" (Ctrl+I).
Q: Can I use MT4 indicators on MT5? A: No, MQL4 and MQL5 are distinct languages; ensure the indicator is compiled specifically for your platform version.
Description & Settings
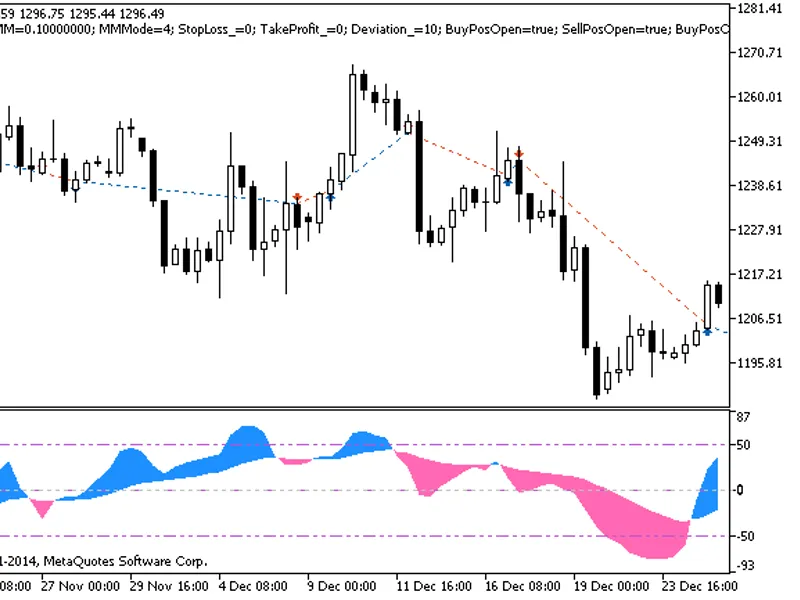
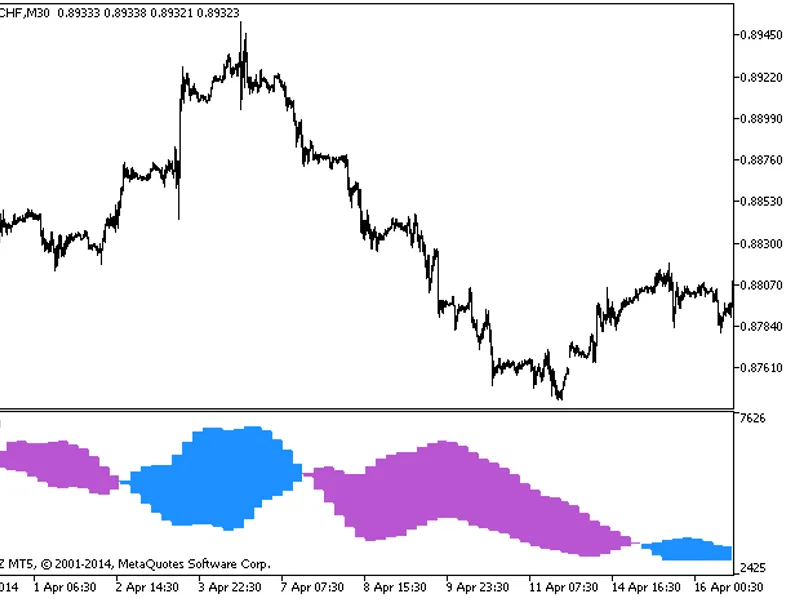
The indicator shows a cloud within a channel formed by two МАs, EMA and LWMA
It has five input parameters:
First LWMA period
- calculation period of the first LWMA
Second LWMA period
- calculation period of the second LWMA
First EMA period
- calculation period of the first EMA
Second EMA period
- calculation period of the second EMA
Applied price
- price used for calculations Recommendations:* Use timeframe H1 or hogher.Components:* 5 LWMA and 8 LWMA (blue lines)* 18 EMA and 28 EMA (red lines)Inputs:* EMA lines touch or cross each other.* LONG: 5 LWMA and 8 LWMA cross the EMA channel upwards.- If 5 LWMA also crosses 8 LWMA upwards, then the signal is strong.* SHORT: 5 LWMA and 8 LWMA cross channel EMA downwards.- If 5 LWMA also crosses 8 LWMA downwards, then the signal is strong.Outputs: * LONG: the price has reached the top, and 5 LWMA has gone under 8 LWMA > Close position. * SHORT: the price has reached the bottom, and 5 LWMA has grown above 8 LWMA > Close position.Other signals:* Always close the position, when the EMA lines touch or cross each other, then analyze again and open a new position in accordance with the signals.Please note! when there is a position and both LWMAs cross the EMA channel, then this is a signal that the EMA lines are going to cross each other in the nearest future.